B Supplementary Figures and Analyses by Study
B.1 Study 1
B.1.1 Study 1a
| Variable | \(n\) | \(M\) | \(SD\) | 1 | 2 | 3 | 4 | 5 | 6 | 7 | 8 | 9 | 10 | 11 | 12 | 13 |
|---|---|---|---|---|---|---|---|---|---|---|---|---|---|---|---|---|
|
571 | 6.30 | 1.93 | |||||||||||||
|
571 | 6.33 | 1.65 | .71* | ||||||||||||
|
571 | 17.15 | 10.41 | -.58* | -.67* | |||||||||||
|
566 | 2.20 | 0.89 | -.60* | -.60* | .71* | ||||||||||
|
570 | 2.33 | 0.95 | -.11* | -.08* | .12* | .14* | |||||||||
|
569 | 2.33 | 0.42 | .01 | .00 | .10* | .10* | .03 | ||||||||
|
570 | 2.48 | 0.59 | .00 | -.03 | .05 | .04 | -.01 | .71* | |||||||
|
570 | 2.40 | 0.75 | -.03 | .01 | .07 | .08* | .05 | .71* | .30* | ||||||
|
569 | 2.74 | 0.66 | .16* | .11* | -.05 | -.07 | -.07 | .77* | .50* | .41* | |||||
|
569 | 1.55 | 0.66 | -.12* | -.10* | .20* | .22* | .11* | .27* | -.09* | -.06 | -.03 | ||||
|
572 | 12.19 | 3.62 | -.09* | -.09* | .20* | .12* | .06 | .08 | .02 | .20* | -.01 | -.06 | |||
|
571 | 4.66 | 0.83 | .03 | -.01 | .01 | .02 | -.04 | .06 | .20* | .09* | .07 | -.27* | .08* | ||
|
568 | 4.98 | 0.74 | .02 | .00 | .00 | .01 | -.09* | .30* | .41* | .22* | .26* | -.18* | .08 | .51* | |
|
568 | 4.40 | 1.36 | .19* | .19* | -.11* | -.16* | -.03 | .05 | .06 | .09* | .06 | -.13* | .17* | .22* | .17* |
| CESD = Center for Epidemiological Studies - Depression Scale | ||||||||||||||||
| Note. Heart = Heart Manikin, Valence = Valence Self-Assessment Manikin, |
B.1.2 Study 1b
| Variable | \(n\) | \(M\) | \(SD\) | 1 | 2 | 3 | 4 | 5 | 6 | 7 | 8 | 9 | 10 | 11 | 12 | 13 | 14 | 15 | 16 | 17 | 18 | 19 | 20 | 21 | 22 | 23 |
|---|---|---|---|---|---|---|---|---|---|---|---|---|---|---|---|---|---|---|---|---|---|---|---|---|---|---|
|
325 | 7.14 | 1.51 | |||||||||||||||||||||||
|
325 | 6.51 | 1.45 | .62* | ||||||||||||||||||||||
|
325 | 7.16 | 1.46 | .08 | .18* | |||||||||||||||||||||
|
325 | 16.60 | 4.97 | -.40* | -.30* | -.18* | ||||||||||||||||||||
|
325 | 36.12 | 4.57 | .48* | .31* | .04 | -.40* | |||||||||||||||||||
|
325 | 34.23 | 5.13 | .36* | .32* | .14* | -.35* | .67* | ||||||||||||||||||
|
325 | 4.64 | 1.07 | .47* | .36* | .00 | -.27* | .44* | .24* | |||||||||||||||||
|
325 | 4.90 | 1.28 | .28* | .21* | -.05 | -.07 | .25* | .16* | .52* | ||||||||||||||||
|
325 | 4.39 | 0.78 | .42* | .30* | -.01 | -.24* | .44* | .22* | .79* | .48* | |||||||||||||||
|
325 | 1.91 | 0.99 | -.25* | -.14* | .00 | .13* | -.18* | -.07 | -.58* | -.23* | -.51* | ||||||||||||||
|
325 | 1.65 | 0.54 | -.43* | -.30* | .03 | .26* | -.39* | -.30* | -.63* | -.48* | -.57* | .22* | |||||||||||||
|
325 | 1.24 | 0.30 | -.11 | -.08 | .12* | .21* | -.06 | -.03 | -.11* | .12* | -.12* | .33* | .00 | ||||||||||||
|
325 | 1.03 | 0.09 | .03 | .07 | -.04 | -.02 | .03 | -.04 | -.02 | .05 | -.02 | .10 | -.06 | .26* | |||||||||||
|
325 | 0.20 | 0.28 | -.14* | -.08 | -.04 | .21* | -.04 | -.08 | -.07 | -.04 | -.03 | .07 | .05 | .22* | .07 | ||||||||||
|
325 | 0.04 | 0.12 | -.18* | -.09 | .06 | .19* | -.12* | -.10 | -.34* | -.11 | -.30* | .47* | .25* | .26* | .07 | .15* | |||||||||
|
325 | 0.05 | 0.12 | -.03 | -.09 | -.02 | .02 | -.01 | -.14* | -.09 | -.05 | -.11 | .20* | .05 | .29* | .05 | .21* | .18* | ||||||||
|
325 | 0.08 | 0.15 | -.13* | -.10 | .08 | .09 | -.08 | -.09 | -.21* | -.05 | -.23* | .31* | .14* | .43* | .15* | .29* | .33* | .33* | |||||||
|
325 | 0.23 | 0.38 | -.10 | -.08 | .11 | .17* | -.08 | -.04 | -.16* | .06 | -.12* | .17* | .16* | .47* | .17* | .28* | .14* | .26* | .40* | ||||||
|
325 | 2.47 | 0.81 | -.08 | -.13* | -.09 | .20* | -.04 | -.11 | .02 | -.02 | .11* | -.14* | .10 | -.05 | -.03 | .14* | -.07 | .05 | -.06 | .06 | |||||
|
325 | 3.86 | 1.34 | -.02 | .03 | -.07 | .02 | -.06 | -.11* | .14* | .12* | .16* | -.03 | -.05 | -.04 | .01 | .05 | -.02 | .06 | -.04 | -.04 | .27* | ||||
|
325 | 11.95 | 1.59 | .07 | .06 | -.06 | -.02 | .03 | .03 | .13* | .14* | .16* | -.08 | -.11 | .13* | .05 | .08 | .05 | .05 | .09 | .06 | .10 | .01 | |||
|
325 | 2.64 | 1.31 | -.17* | -.15* | .12* | .13* | -.24* | -.17* | -.21* | .04 | -.17* | .10 | .17* | .16* | .10 | .15* | -.05 | .13* | .14* | .16* | .20* | -.06 | .01 | ||
|
325 | 1.69 | 0.64 | -.45* | -.43* | -.09 | .49* | -.36* | -.35* | -.33* | -.16* | -.28* | .18* | .35* | .18* | .01 | .26* | .21* | .10 | .18* | .24* | .30* | .02 | -.05 | .19* | |
|
325 | 0.85 | 0.54 | -.53* | -.46* | -.08 | .57* | -.47* | -.45* | -.42* | -.22* | -.38* | .16* | .46* | .18* | .03 | .18* | .20* | .11* | .14* | .21* | .25* | .07 | -.05 | .27* | .78* |
| Note. Heart = Heart Manikin, Valence = Valence Self-Assessment Manikin, SES = Subjective Socioeconomic Status, IOS = Inclusion of the Other in the Self Scale, CESD = Center for Epidemiological Studies - Depression Scale |
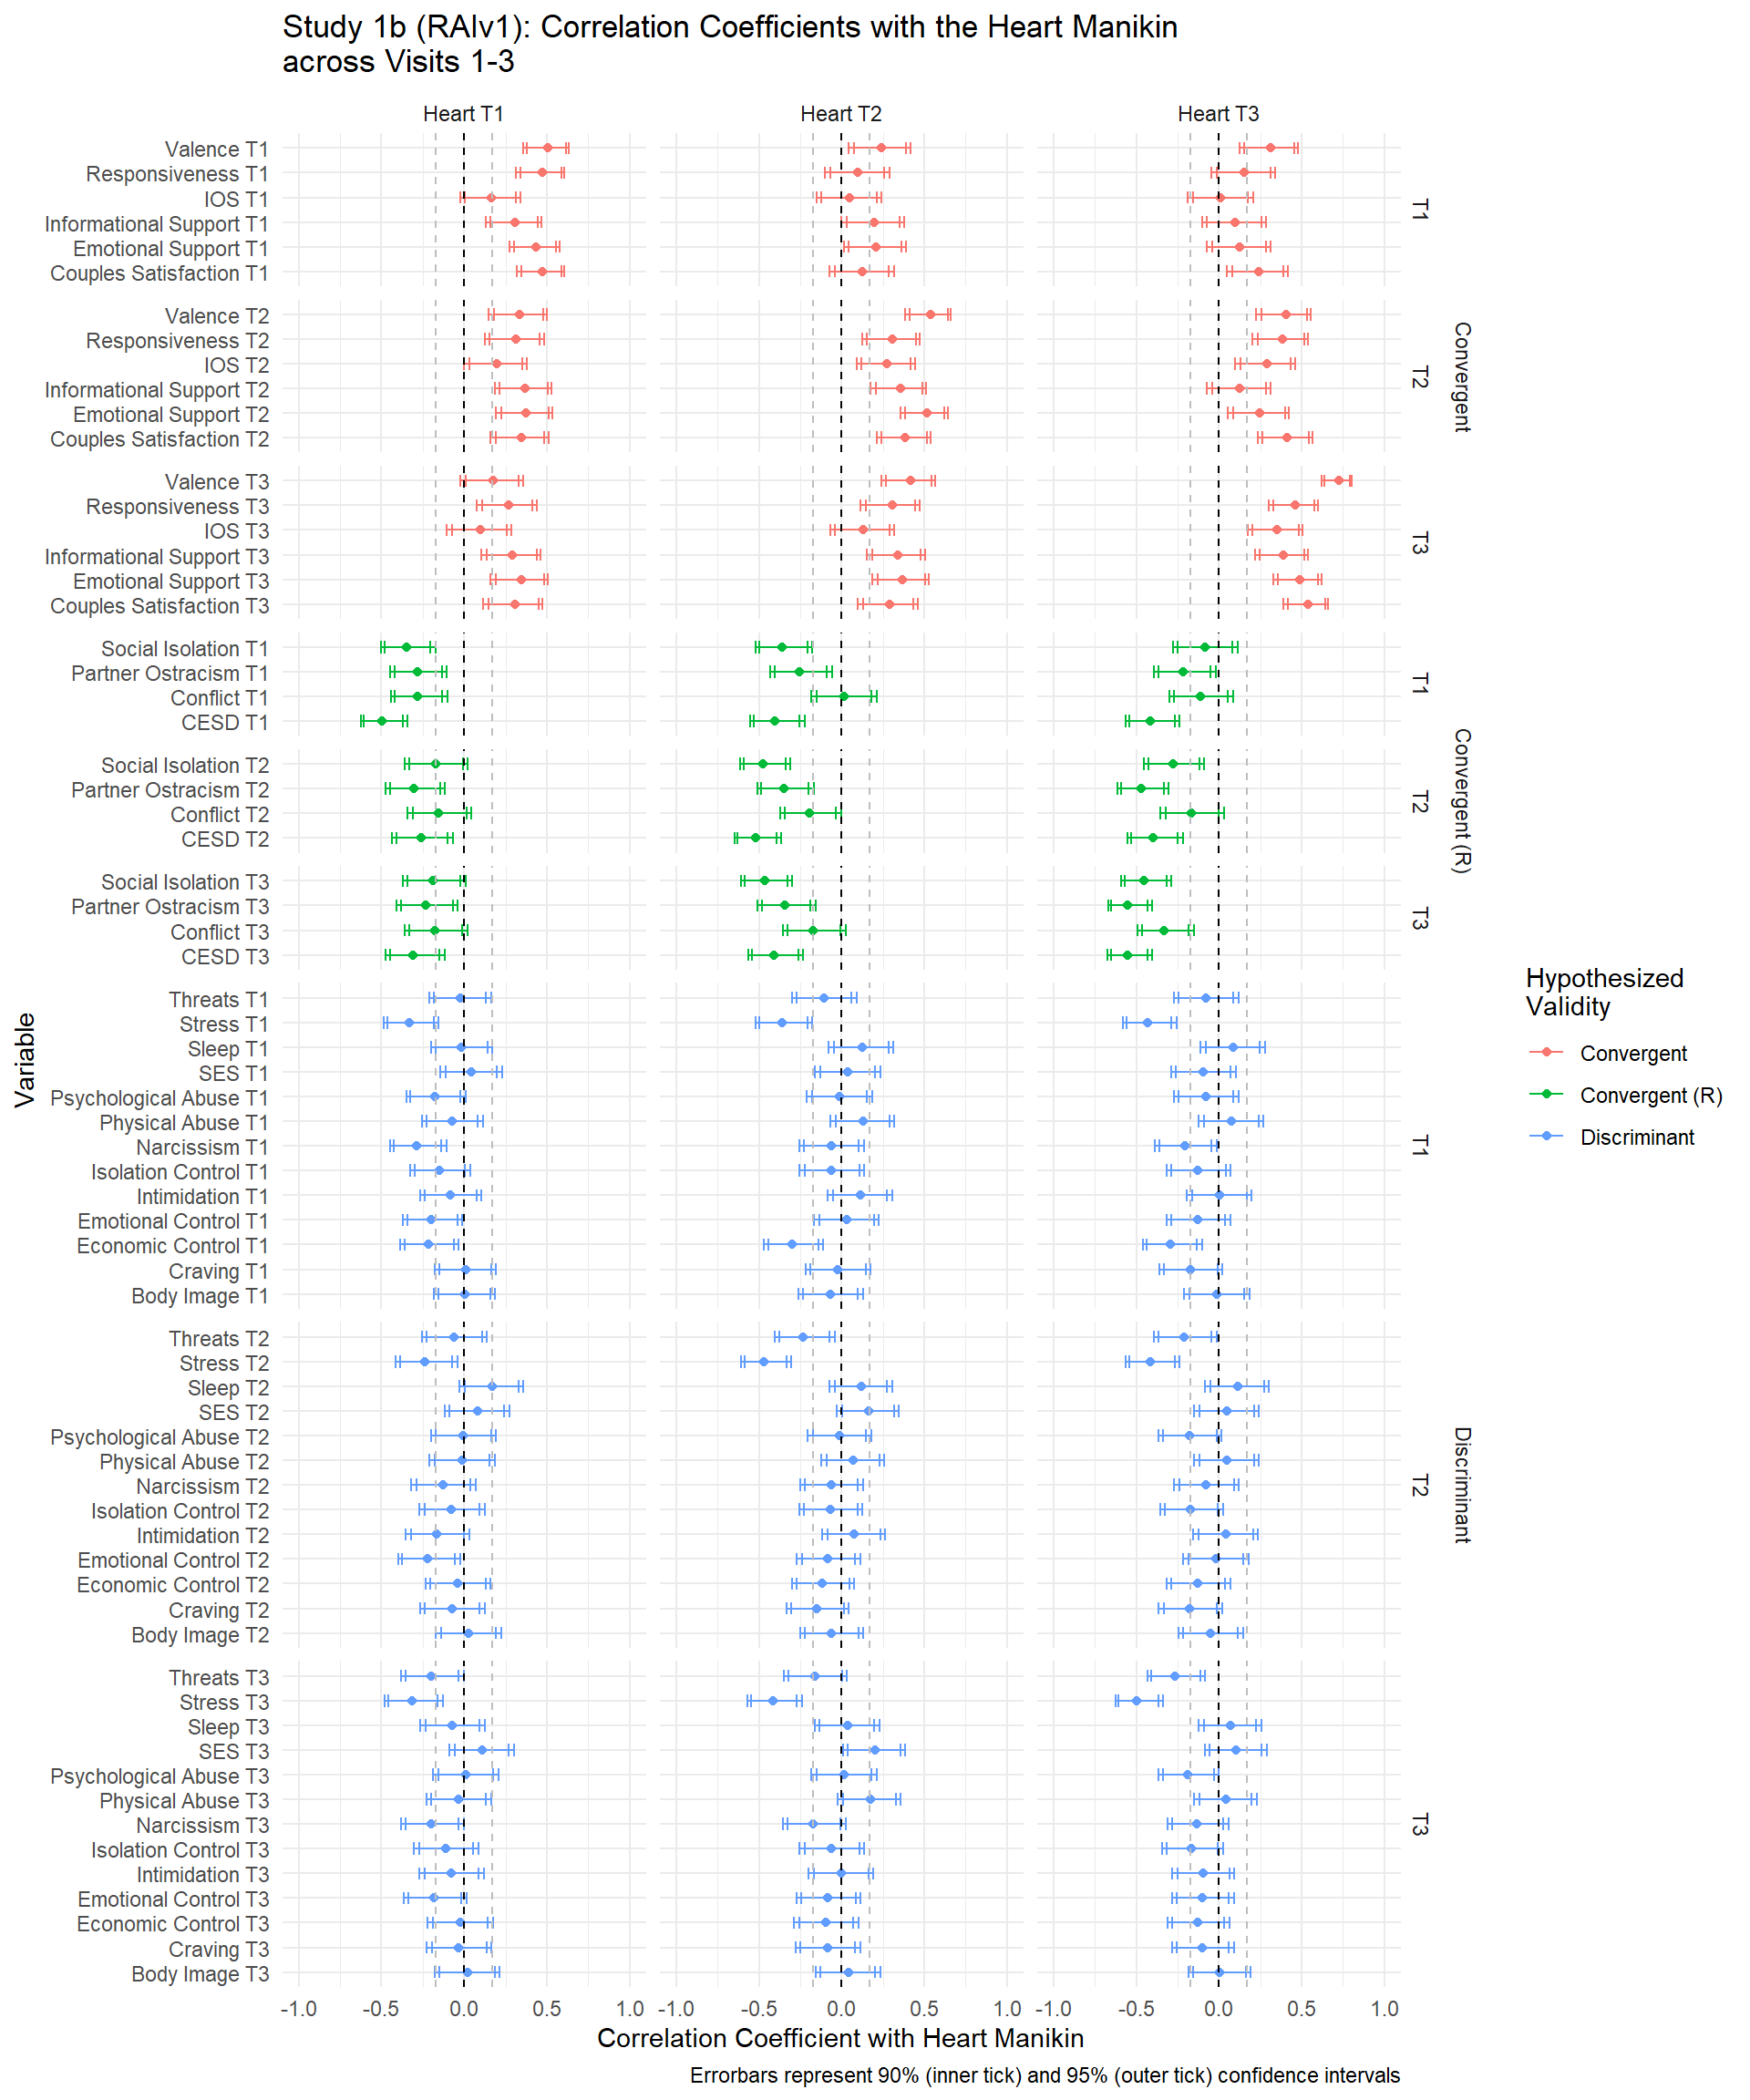
Figure B.1: Study 1b (RAIv1) - Forest plot of correlation coefficients of the measured variables with the Heart Manikin Scores
B.1.3 Study 1c (ARv1)
| Variable | \(n\) | \(M\) | \(SD\) | 1 | 2 | 3 | 4 | 5 | 6 | 7 | 8 | 9 | 10 | 11 | 12 | 13 |
|---|---|---|---|---|---|---|---|---|---|---|---|---|---|---|---|---|
|
290 | 6.69 | 1.81 | |||||||||||||
|
290 | 5.11 | 2.96 | .12* | ||||||||||||
|
290 | 6.64 | 2.39 | .66* | .48* | |||||||||||
|
290 | 6.58 | 1.79 | .70* | .11 | .52* | ||||||||||
|
290 | 5.08 | 2.84 | .13* | .92* | .46* | .16* | |||||||||
|
290 | 7.00 | 2.64 | .51* | .42* | .73* | .53* | .43* | ||||||||
|
290 | 5.47 | 2.07 | .07 | .33* | .26* | .00 | .34* | .25* | |||||||
|
290 | 4.92 | 2.26 | .05 | .80* | .37* | .09 | .75* | .34* | .30* | ||||||
|
290 | 55.05 | 35.12 | .02 | .85* | .35* | -.01 | .85* | .31* | .28* | .68* | |||||
|
290 | 53.24 | 31.42 | .08 | .80* | .37* | .08 | .80* | .36* | .25* | .71* | .84* | ||||
|
290 | 39.24 | 26.52 | .06 | .64* | .33* | .09 | .63* | .28* | .21* | .68* | .58* | .71* | |||
|
290 | 57.72 | 30.77 | .00 | .78* | .30* | -.03 | .75* | .29* | .29* | .65* | .87* | .83* | .60* | ||
|
290 | 51.60 | 28.33 | .04 | .86* | .37* | .03 | .85* | .34* | .29* | .75* | .94* | .94* | .77* | .93* | |
|
290 | 48.90 | 19.08 | .27* | .12* | .18* | .22* | .09 | .14* | .03 | .15* | .06 | .11 | .11 | .02 | .08 |
| Note. Heart = the Heart Manikin, SES = Subjective Socioeconomic Status, IOS = Inclusion of the Other in the Self Scale, NTS = the Need-Threat Scale |
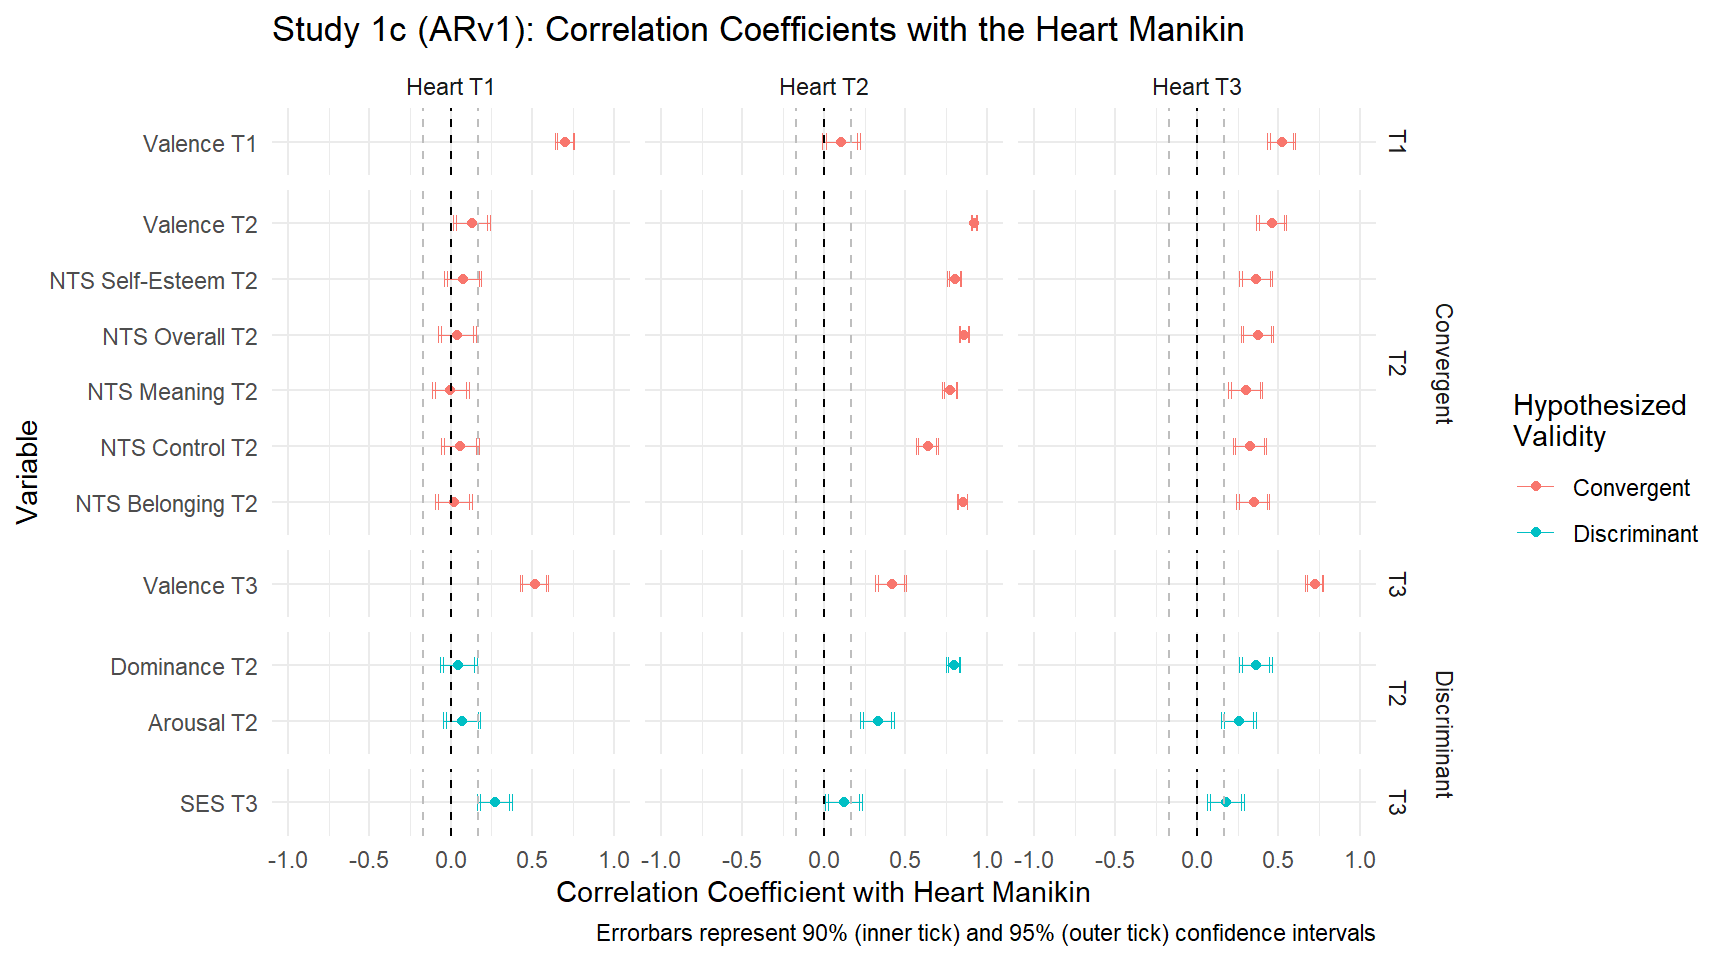
Figure B.2: Study 1c - Forestplot of Correlation Coefficients between the Measured Variabels with the Heart Manikin
I explored whether the heart manikin scores changed across time by condition in a mixed model.
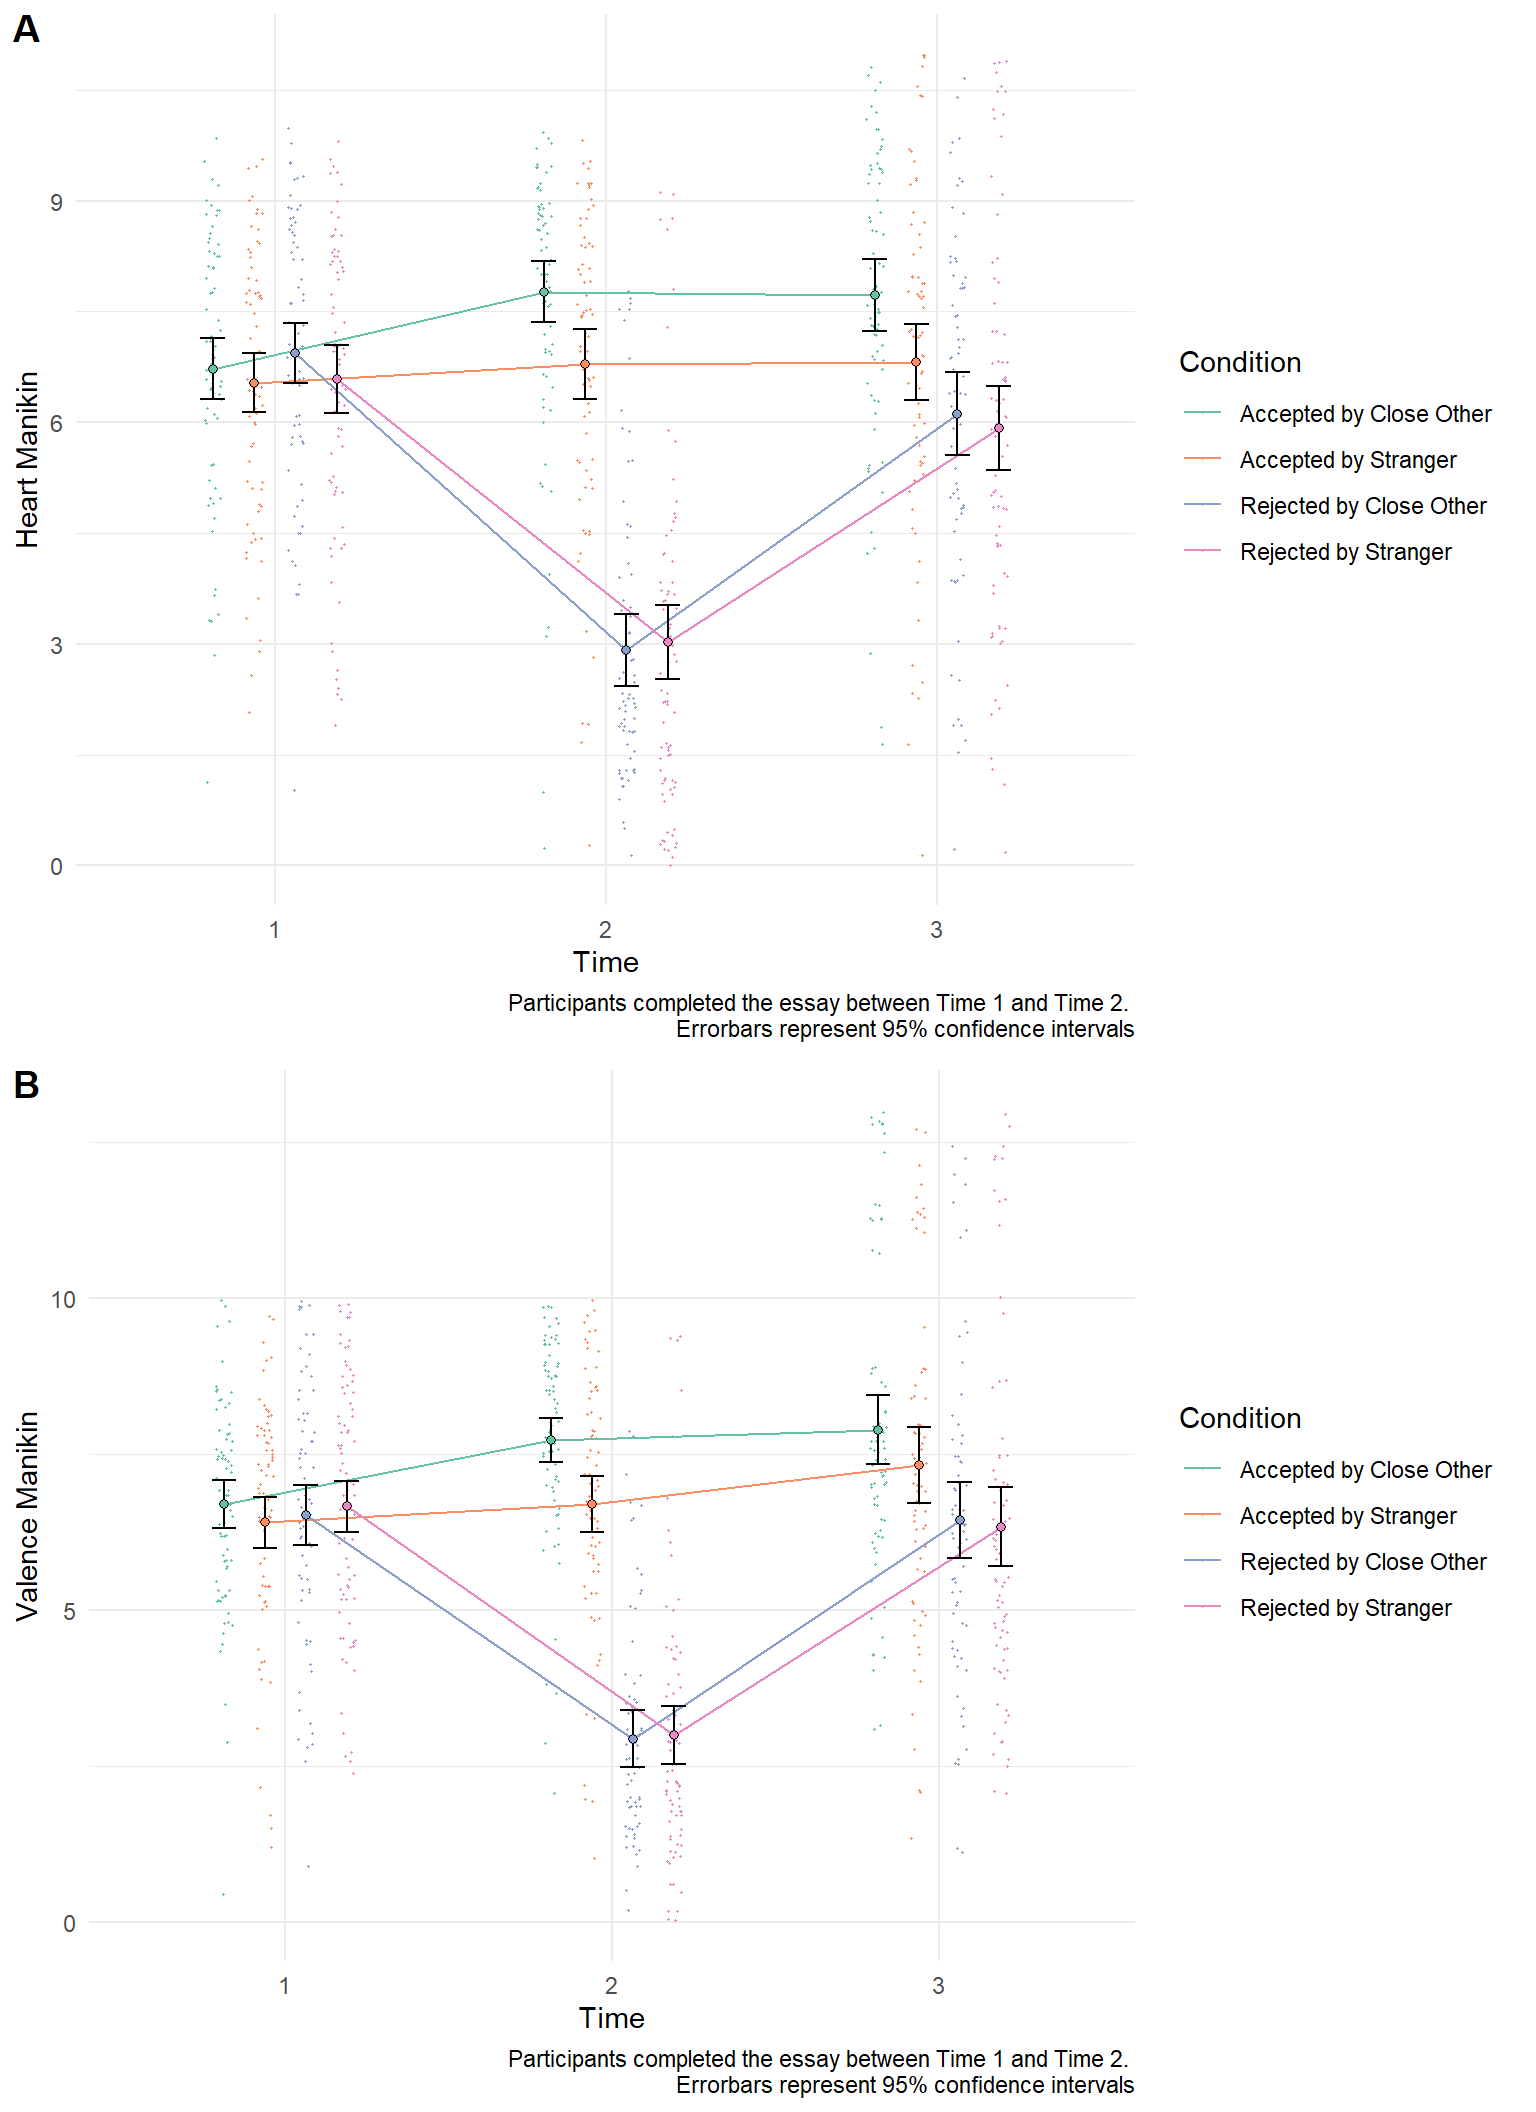
Figure B.3: Study 1c - Heart Manikin Scores Across Time and Conditions
B.1.4 Study 1d (EVv1)
| Variable | \(n\) | \(M\) | \(SD\) | 1 | 2 | 3 | 4 | 5 | 6 | 7 | 8 | 9 | 10 | 11 | 12 | 13 | 14 | 15 | 16 | 17 | 18 | 19 | 20 | 21 | 22 | 23 | 24 | 25 | 26 | 27 | 28 |
|---|---|---|---|---|---|---|---|---|---|---|---|---|---|---|---|---|---|---|---|---|---|---|---|---|---|---|---|---|---|---|---|
|
242 | 6.57 | 1.79 | ||||||||||||||||||||||||||||
|
242 | 6.63 | 1.60 | .84* | |||||||||||||||||||||||||||
|
238 | 6.34 | 1.81 | .59* | .66* | ||||||||||||||||||||||||||
|
237 | 6.37 | 1.64 | .70* | .80* | .74* | |||||||||||||||||||||||||
|
242 | 6.66 | 1.35 | .47* | .44* | .35* | .39* | ||||||||||||||||||||||||
|
242 | 6.45 | 1.39 | .22* | .41* | .15* | .27* | .59* | |||||||||||||||||||||||
|
238 | 6.03 | 1.78 | .25* | .27* | .65* | .37* | .46* | .34* | ||||||||||||||||||||||
|
237 | 5.93 | 1.61 | .39* | .47* | .49* | .56* | .61* | .49* | .61* | |||||||||||||||||||||
|
242 | 4.05 | 1.48 | .09 | .12 | .04 | .07 | .24* | .25* | .25* | .25* | ||||||||||||||||||||
|
242 | 4.74 | 1.64 | .02 | .11 | -.05 | -.01 | .28* | .37* | .15* | .21* | .66* | |||||||||||||||||||
|
238 | 4.74 | 1.74 | .01 | .04 | .17* | .05 | .21* | .17* | .38* | .30* | .59* | .72* | ||||||||||||||||||
|
237 | 4.79 | 1.71 | .13 | .18* | .09 | .12 | .26* | .30* | .27* | .34* | .61* | .73* | .74* | |||||||||||||||||
|
242 | 6.23 | 1.50 | .31* | .31* | .23* | .34* | .30* | .23* | .17* | .35* | .07 | .11 | .12 | .14* | ||||||||||||||||
|
242 | 6.34 | 1.42 | .26* | .43* | .31* | .41* | .31* | .35* | .21* | .36* | .08 | .16* | .09 | .16* | .75* | |||||||||||||||
|
238 | 6.21 | 1.53 | .16* | .29* | .51* | .44* | .24* | .25* | .49* | .43* | .04 | .04 | .18* | .13* | .62* | .69* | ||||||||||||||
|
237 | 6.23 | 1.51 | .27* | .37* | .40* | .54* | .30* | .20* | .33* | .55* | .06 | .05 | .08 | .14* | .61* | .71* | .67* | |||||||||||||
|
241 | 1.54 | 0.96 | .57* | .57* | .43* | .49* | .41* | .32* | .30* | .35* | .03 | .05 | .03 | .06 | .30* | .34* | .31* | .34* | ||||||||||||
|
238 | 0.33 | 0.76 | -.06 | -.07 | -.08 | -.04 | .03 | -.02 | -.08 | .01 | .02 | .12 | .08 | .09 | -.07 | -.04 | -.07 | -.09 | -.19* | |||||||||||
|
238 | 72.51 | 20.50 | .23* | .26* | .63* | .36* | .18* | -.01 | .57* | .27* | .00 | -.08 | .19* | .03 | .13* | .18* | .41* | .21* | .28* | -.18* | ||||||||||
|
238 | 69.90 | 19.48 | .28* | .31* | .61* | .43* | .28* | .09 | .61* | .37* | .09 | -.05 | .19* | .08 | .21* | .26* | .49* | .40* | .49* | -.20* | .71* | |||||||||
|
238 | 49.46 | 21.11 | .06 | .13* | .31* | .23* | .13* | .11 | .35* | .30* | .04 | .02 | .17* | .08 | .16* | .27* | .42* | .34* | .27* | -.14* | .48* | .54* | ||||||||
|
238 | 76.45 | 18.00 | .33* | .33* | .64* | .41* | .28* | .06 | .59* | .31* | .10 | -.01 | .23* | .10 | .15* | .19* | .43* | .29* | .45* | -.15* | .76* | .79* | .45* | |||||||
|
238 | 65.27 | 16.65 | .25* | .30* | .60* | .41* | .27* | .11 | .60* | .39* | .09 | -.02 | .23* | .10 | .20* | .28* | .52* | .40* | .47* | -.19* | .75* | .90* | .80* | .86* | ||||||
|
237 | 75.65 | 16.70 | .31* | .38* | .55* | .54* | .24* | .10 | .41* | .41* | .07 | -.07 | .08 | .03 | .17* | .25* | .40* | .43* | .43* | -.20* | .61* | .62* | .37* | .63* | .62* | |||||
|
237 | 66.59 | 20.17 | .28* | .42* | .41* | .52* | .28* | .23* | .26* | .46* | .06 | -.04 | .01 | .04 | .22* | .31* | .36* | .54* | .47* | -.15* | .28* | .55* | .35* | .38* | .50* | .67* | ||||
|
237 | 51.86 | 22.80 | .18* | .28* | .26* | .37* | .25* | .19* | .14* | .35* | .09 | .03 | .06 | .04 | .24* | .31* | .31* | .45* | .37* | -.16* | .19* | .40* | .57* | .27* | .49* | .44* | .65* | |||
|
237 | 77.25 | 16.49 | .30* | .40* | .51* | .53* | .22* | .11 | .39* | .43* | .09 | -.01 | .10 | .08 | .19* | .29* | .40* | .50* | .46* | -.12 | .46* | .57* | .35* | .58* | .58* | .80* | .72* | .48* | ||
|
237 | 68.44 | 15.95 | .31* | .43* | .50* | .58* | .29* | .19* | .35* | .48* | .09 | -.03 | .07 | .05 | .24* | .34* | .43* | .56* | .51* | -.19* | .45* | .63* | .49* | .54* | .65* | .85* | .89* | .78* | .87* | |
|
237 | 418.70 | 226.03 | .01 | -.07 | .00 | -.05 | .00 | -.08 | -.04 | -.01 | -.15* | -.12 | -.09 | -.06 | .13* | .11 | .04 | .11 | .00 | .07 | .01 | -.01 | -.01 | -.06 | -.03 | -.03 | .01 | .01 | -.02 | -.01 |
| Note. Heart = the Heart Manikin, NTS = the Need-Threat Scale |
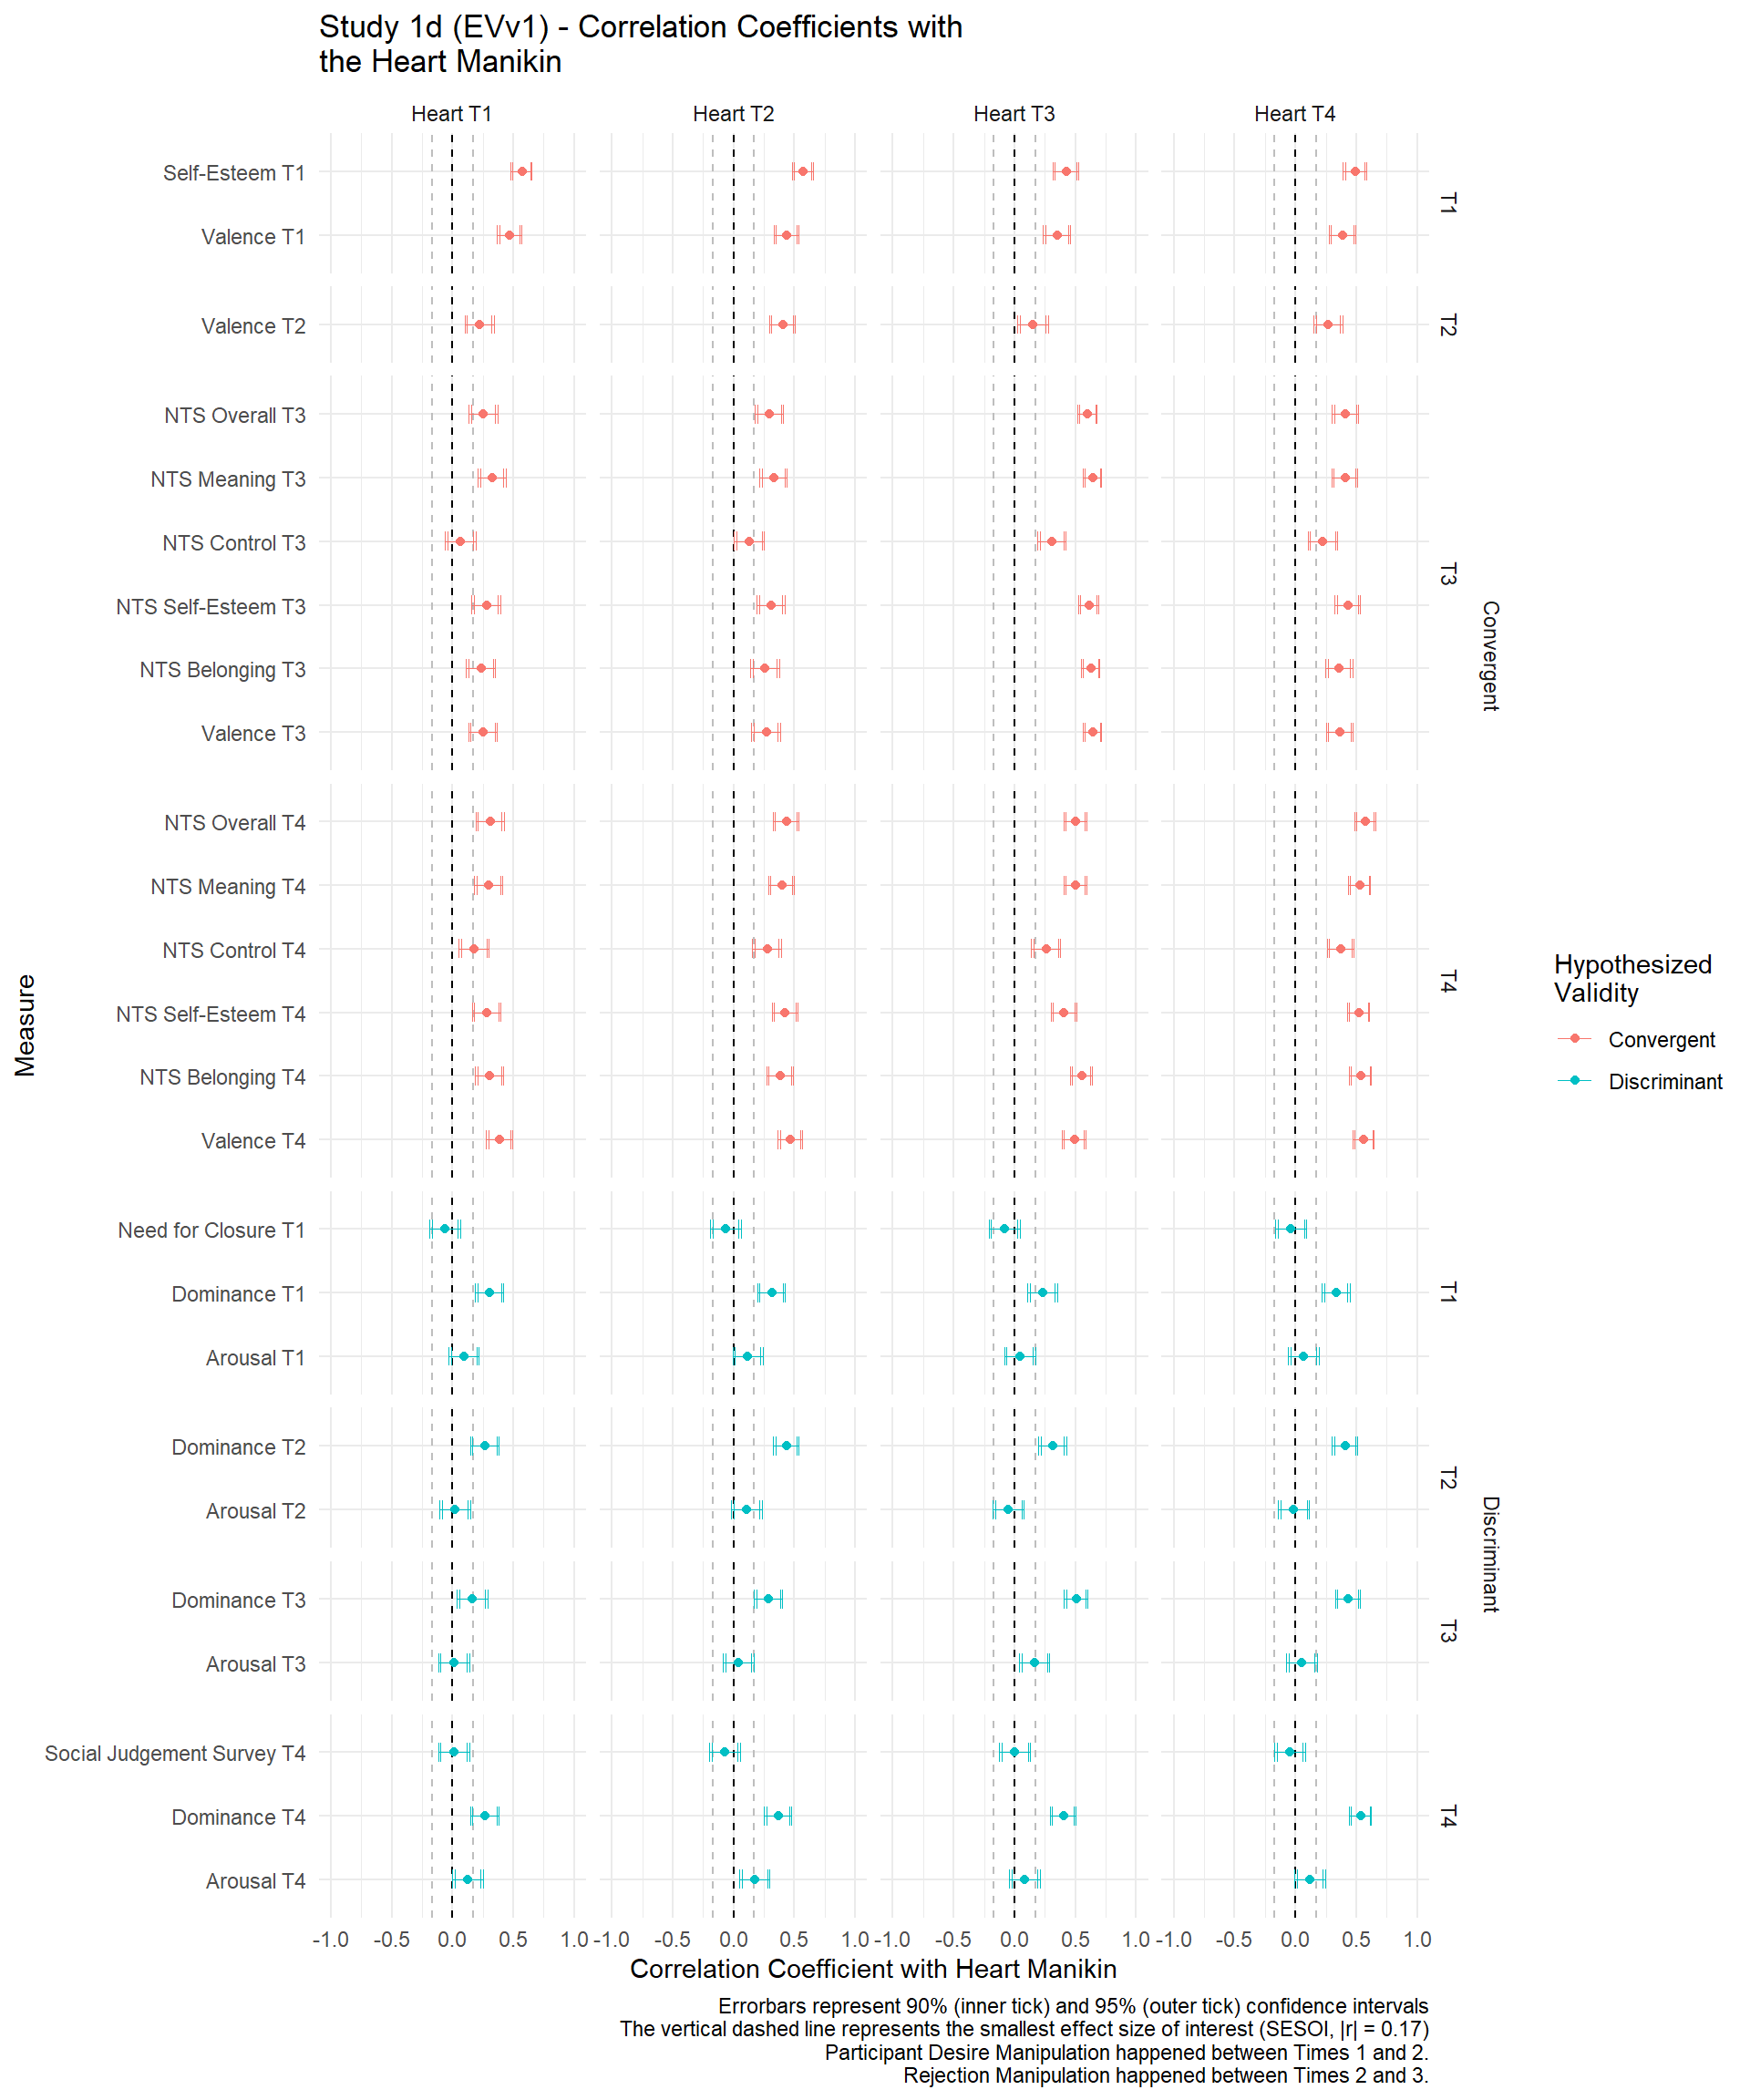
Figure B.4: Study 1d - Forestplot of Correlation Coefficients between the Measured Scores and the Heart Manikin
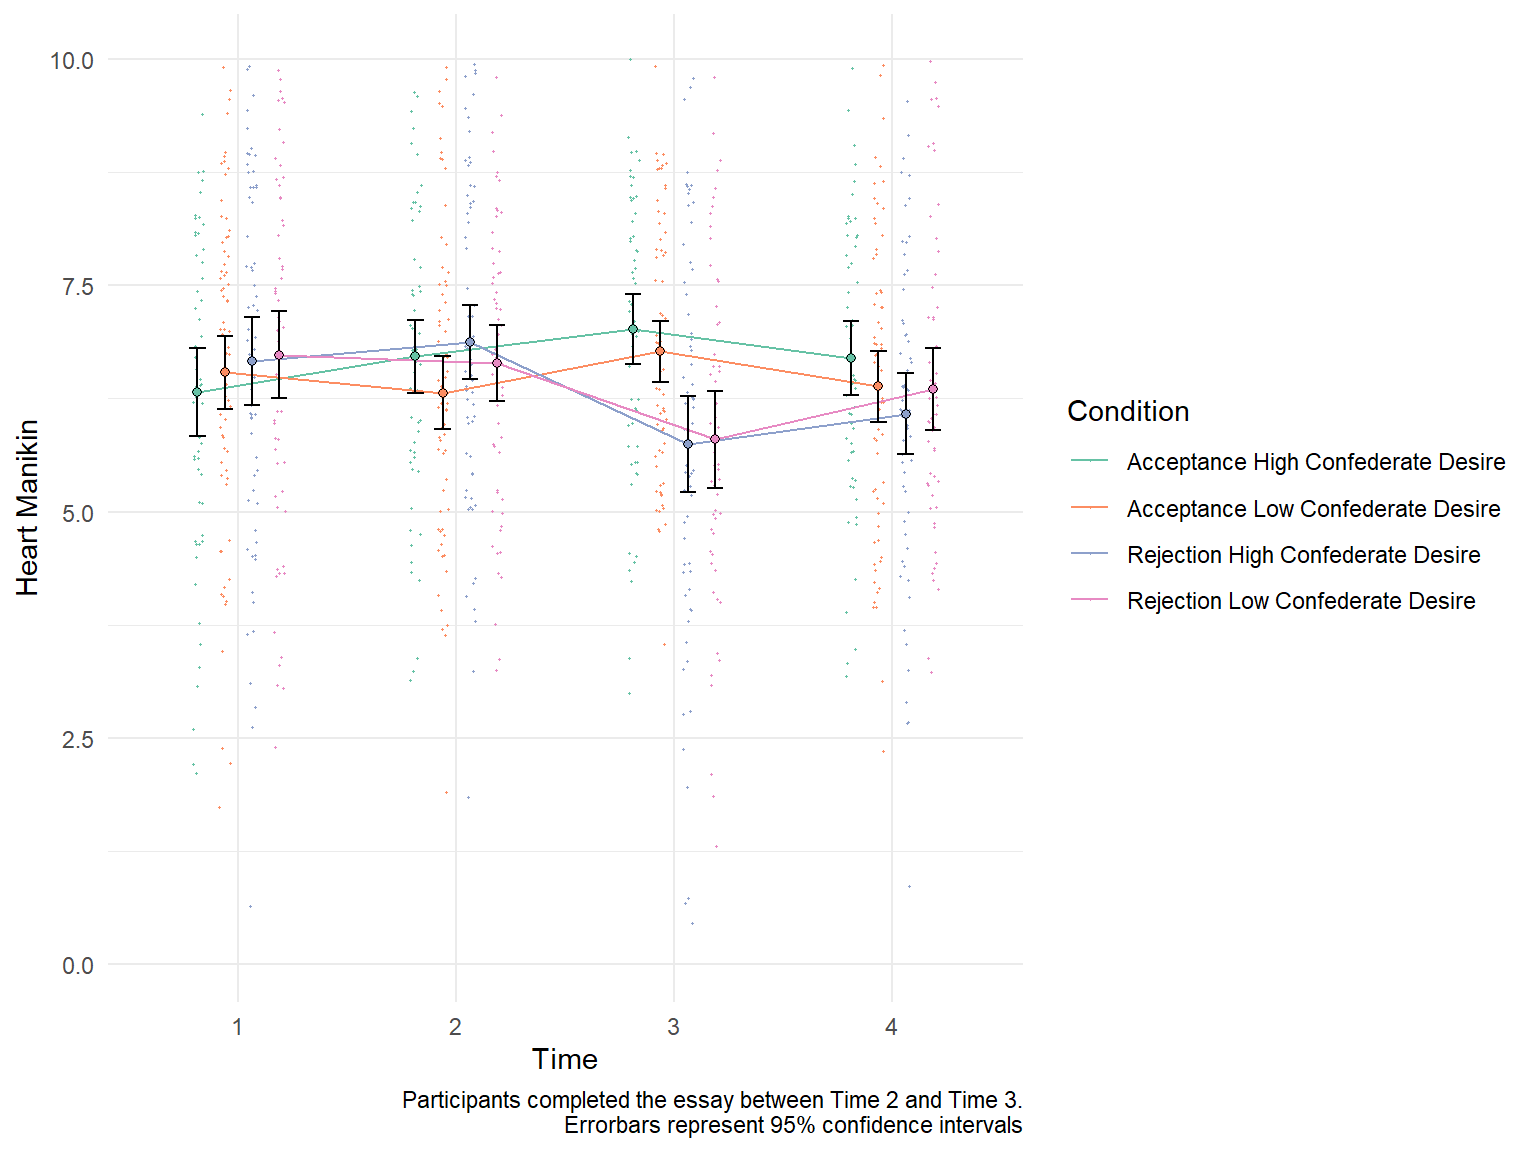
Figure B.5: Study 1d - Heart Manikin Across Time
B.1.5 Study 1e (NPSv2)
| Variable | \(n\) | \(M\) | \(SD\) | 1 | 2 | 3 | 4 | 5 | 6 | 7 | 8 | 9 | 10 | 11 | 12 | 13 | 14 | 15 | 16 | 17 | 18 | 19 | 20 | 21 | 22 | 23 | 24 | 25 | 26 | 27 | 28 | 29 | 30 | 31 | 32 | 33 | 34 | 35 | 36 | 37 | 38 | 39 |
|---|---|---|---|---|---|---|---|---|---|---|---|---|---|---|---|---|---|---|---|---|---|---|---|---|---|---|---|---|---|---|---|---|---|---|---|---|---|---|---|---|---|---|
|
538 | 6.96 | 1.62 | |||||||||||||||||||||||||||||||||||||||
|
538 | 7.00 | 1.49 | .83* | ||||||||||||||||||||||||||||||||||||||
|
538 | 6.89 | 1.55 | .71* | .84* | |||||||||||||||||||||||||||||||||||||
|
538 | 6.83 | 1.58 | .63* | .69* | .63* | ||||||||||||||||||||||||||||||||||||
|
538 | 6.63 | 1.73 | .61* | .65* | .59* | .85* | |||||||||||||||||||||||||||||||||||
|
538 | 6.81 | 1.56 | .65* | .71* | .66* | .87* | .87* | ||||||||||||||||||||||||||||||||||
|
538 | 6.40 | 1.51 | .52* | .49* | .42* | .40* | .39* | .43* | |||||||||||||||||||||||||||||||||
|
538 | 6.39 | 1.45 | .46* | .51* | .43* | .42* | .36* | .43* | .71* | ||||||||||||||||||||||||||||||||
|
538 | 6.48 | 1.64 | .42* | .45* | .59* | .41* | .35* | .43* | .55* | .68* | |||||||||||||||||||||||||||||||
|
538 | 6.16 | 1.56 | .40* | .44* | .43* | .54* | .50* | .53* | .49* | .53* | .54* | ||||||||||||||||||||||||||||||
|
538 | 5.89 | 1.67 | .42* | .43* | .39* | .57* | .65* | .57* | .46* | .48* | .45* | .82* | |||||||||||||||||||||||||||||
|
538 | 6.19 | 1.61 | .42* | .46* | .43* | .55* | .55* | .59* | .49* | .55* | .51* | .82* | .82* | ||||||||||||||||||||||||||||
|
538 | 4.37 | 1.46 | .16* | .16* | .11* | .11* | .10* | .14* | .27* | .26* | .24* | .18* | .17* | .20* | |||||||||||||||||||||||||||
|
538 | 4.65 | 1.56 | .12* | .13* | .07 | .10* | .07 | .10* | .19* | .34* | .23* | .15* | .15* | .18* | .72* | ||||||||||||||||||||||||||
|
538 | 4.90 | 1.62 | .12* | .11* | .15* | .10* | .07 | .11* | .16* | .27* | .33* | .19* | .16* | .19* | .66* | .85* | |||||||||||||||||||||||||
|
538 | 4.56 | 1.60 | .08 | .13* | .12* | .17* | .15* | .13* | .13* | .18* | .21* | .35* | .28* | .26* | .44* | .48* | .49* | ||||||||||||||||||||||||
|
538 | 4.59 | 1.59 | .11* | .15* | .10* | .15* | .16* | .16* | .14* | .19* | .17* | .28* | .31* | .27* | .45* | .49* | .50* | .85* | |||||||||||||||||||||||
|
538 | 4.78 | 1.63 | .07 | .12* | .08 | .13* | .14* | .17* | .11* | .20* | .19* | .30* | .30* | .32* | .45* | .49* | .51* | .83* | .88* | ||||||||||||||||||||||
|
538 | 6.25 | 1.40 | .34* | .33* | .27* | .26* | .28* | .29* | .27* | .25* | .27* | .15* | .20* | .22* | .12* | .12* | .08 | .06 | .07 | .07 | |||||||||||||||||||||
|
538 | 6.36 | 1.37 | .33* | .39* | .36* | .30* | .32* | .33* | .28* | .32* | .34* | .25* | .26* | .29* | .12* | .13* | .09* | .07 | .08 | .08 | .78* | ||||||||||||||||||||
|
538 | 6.38 | 1.39 | .33* | .38* | .43* | .31* | .32* | .34* | .29* | .33* | .46* | .29* | .30* | .32* | .14* | .14* | .14* | .08 | .06 | .08 | .71* | .89* | |||||||||||||||||||
|
538 | 6.38 | 1.37 | .34* | .38* | .34* | .48* | .45* | .44* | .23* | .30* | .33* | .41* | .43* | .39* | .11* | .07 | .08 | .16* | .14* | .13* | .54* | .64* | .64* | ||||||||||||||||||
|
538 | 6.21 | 1.46 | .37* | .40* | .37* | .45* | .57* | .50* | .27* | .31* | .31* | .36* | .50* | .41* | .08 | .08 | .07 | .11* | .14* | .11* | .54* | .66* | .66* | .82* | |||||||||||||||||
|
538 | 6.35 | 1.41 | .37* | .41* | .38* | .46* | .49* | .54* | .30* | .33* | .33* | .39* | .44* | .44* | .10* | .09* | .08 | .06 | .10* | .12* | .56* | .65* | .66* | .80* | .83* | ||||||||||||||||
|
510 | -0.94 | 1.05 | -.41* | -.42* | -.36* | -.37* | -.40* | -.39* | -.23* | -.20* | -.22* | -.17* | -.19* | -.20* | -.11* | -.05 | -.06 | -.10* | -.09* | -.06 | -.15* | -.17* | -.18* | -.25* | -.25* | -.21* | |||||||||||||||
|
510 | -0.38 | 1.09 | -.41* | -.35* | -.32* | -.35* | -.37* | -.38* | -.27* | -.22* | -.20* | -.19* | -.24* | -.22* | -.06 | .05 | .08 | .08 | .07 | .08 | -.25* | -.26* | -.22* | -.24* | -.26* | -.28* | .18* | ||||||||||||||
|
538 | 3.04 | 0.80 | -.30* | -.26* | -.25* | -.28* | -.30* | -.28* | -.19* | -.16* | -.14* | -.16* | -.21* | -.19* | -.01 | .06 | .09* | .07 | .08 | .08 | -.34* | -.35* | -.30* | -.30* | -.31* | -.29* | .14* | .48* | |||||||||||||
|
538 | 1.44 | 1.02 | .52* | .49* | .43* | .49* | .47* | .50* | .45* | .34* | .30* | .30* | .35* | .36* | .13* | .08 | .06 | .03 | .05 | .02 | .38* | .35* | .33* | .36* | .41* | .38* | -.39* | -.53* | -.54* | ||||||||||||
|
538 | 66.04 | 13.19 | .05 | .05 | .04 | .01 | .03 | .04 | .09* | .06 | .02 | -.06 | -.03 | -.06 | .05 | .02 | .03 | -.02 | .00 | -.03 | .07 | -.01 | -.01 | -.03 | -.01 | .00 | -.10* | -.03 | .01 | .07 | |||||||||||
|
538 | 7.12 | 2.96 | -.40* | -.39* | -.35* | -.36* | -.37* | -.36* | -.29* | -.16* | -.18* | -.26* | -.28* | -.24* | -.01 | .09* | .08 | .02 | .04 | .06 | -.24* | -.24* | -.23* | -.25* | -.28* | -.24* | .32* | .39* | .35* | -.41* | -.11* | ||||||||||
|
535 | 81.60 | 15.38 | .43* | .44* | .55* | .45* | .43* | .47* | .33* | .29* | .44* | .34* | .32* | .33* | .04 | .05 | .10* | .10* | .05 | .07 | .27* | .29* | .32* | .26* | .32* | .29* | -.29* | -.30* | -.27* | .45* | .06 | -.31* | |||||||||
|
536 | 80.58 | 15.54 | .49* | .46* | .45* | .57* | .66* | .58* | .32* | .28* | .29* | .34* | .47* | .40* | .02 | .02 | .03 | .03 | .05 | .06 | .32* | .33* | .30* | .36* | .49* | .41* | -.32* | -.40* | -.37* | .55* | .03 | -.34* | .69* | ||||||||
|
536 | 70.00 | 18.61 | .39* | .42* | .46* | .37* | .37* | .39* | .38* | .34* | .38* | .32* | .34* | .34* | .05 | .08 | .06 | .04 | .03 | .05 | .38* | .41* | .42* | .34* | .42* | .39* | -.22* | -.32* | -.44* | .59* | .06 | -.37* | .65* | .51* | |||||||
|
538 | 68.26 | 19.22 | .40* | .37* | .32* | .48* | .58* | .50* | .32* | .27* | .20* | .31* | .47* | .40* | .08 | .08 | .03 | .01 | .05 | .05 | .39* | .40* | .36* | .41* | .53* | .46* | -.21* | -.42* | -.50* | .64* | .03 | -.34* | .42* | .69* | .62* | ||||||
|
538 | 53.35 | 20.12 | .20* | .24* | .27* | .23* | .23* | .25* | .23* | .25* | .31* | .22* | .25* | .24* | .12* | .14* | .13* | .13* | .15* | .17* | .32* | .38* | .38* | .36* | .40* | .38* | -.11* | -.14* | -.23* | .34* | .00 | -.18* | .33* | .28* | .53* | .36* | |||||
|
538 | 55.26 | 20.47 | .28* | .28* | .27* | .38* | .45* | .40* | .22* | .23* | .24* | .31* | .44* | .36* | .14* | .11* | .10* | .12* | .17* | .16* | .36* | .38* | .38* | .46* | .54* | .50* | -.19* | -.27* | -.29* | .47* | .04 | -.28* | .33* | .49* | .46* | .63* | .56* | ||||
|
535 | 79.91 | 15.45 | .38* | .39* | .44* | .41* | .39* | .43* | .37* | .35* | .44* | .36* | .35* | .35* | .11* | .15* | .14* | .12* | .09* | .11* | .31* | .32* | .34* | .29* | .34* | .35* | -.23* | -.28* | -.31* | .54* | .04 | -.32* | .71* | .56* | .68* | .46* | .41* | .37* | |||
|
538 | 77.92 | 17.53 | .40* | .37* | .31* | .53* | .62* | .52* | .31* | .26* | .21* | .30* | .47* | .36* | .09* | .09* | .06 | .07 | .10* | .10* | .32* | .31* | .26* | .35* | .48* | .40* | -.29* | -.37* | -.39* | .59* | .00 | -.31* | .45* | .78* | .46* | .74* | .30* | .54* | .52* | ||
|
534 | 72.00 | 13.98 | .43* | .46* | .53* | .45* | .44* | .47* | .40* | .37* | .48* | .38* | .38* | .38* | .09* | .12* | .13* | .12* | .10* | .12* | .39* | .43* | .45* | .38* | .46* | .44* | -.26* | -.32* | -.38* | .58* | .05 | -.36* | .83* | .62* | .88* | .57* | .71* | .53* | .84* | .53* | |
|
536 | 71.24 | 15.39 | .46* | .43* | .40* | .57* | .67* | .58* | .34* | .30* | .28* | .37* | .54* | .44* | .09* | .09* | .06 | .07 | .11* | .11* | .40* | .42* | .38* | .46* | .60* | .52* | -.29* | -.43* | -.45* | .66* | .03 | -.37* | .55* | .87* | .60* | .89* | .44* | .78* | .56* | .88* | .66* |
| Note. Heart = the Heart Manikin, NTS = the Need-Threat Scale |
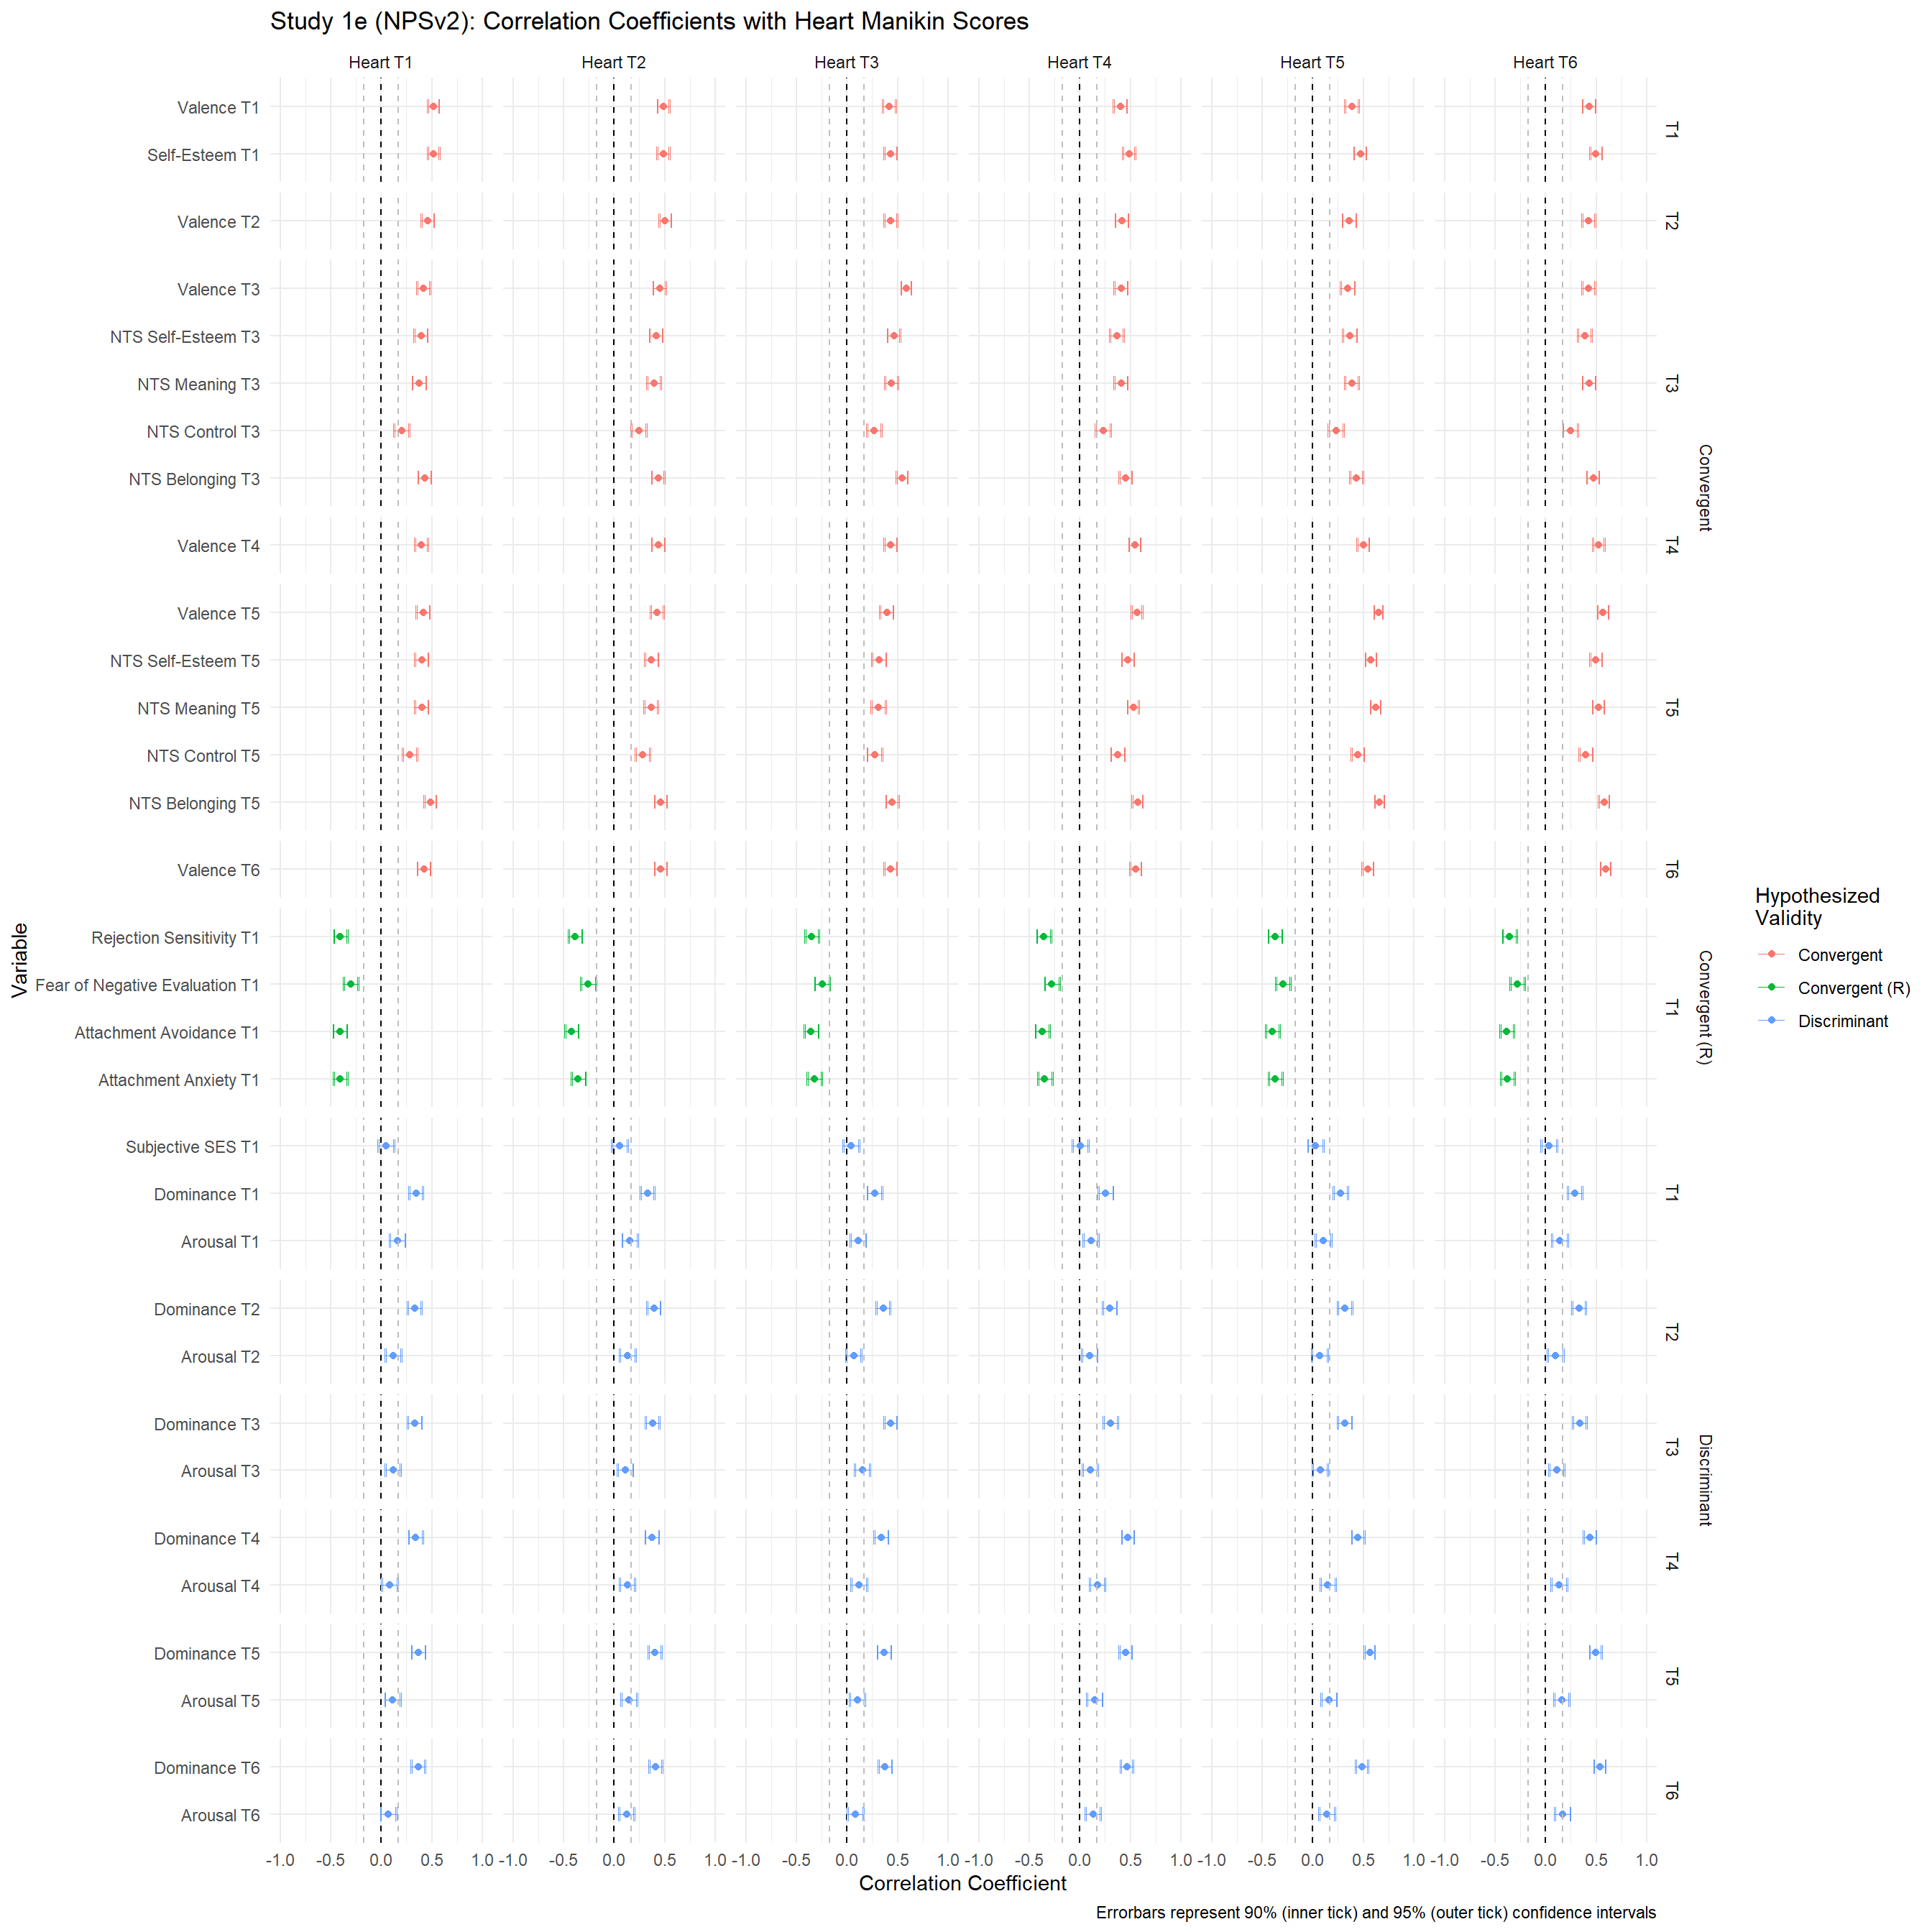
Figure B.6: Study 1e - Forestplot of Correlations between the Measured Variables and the Heart Manikin Scores
I explored whether participants reported different levels of belonging across time, depending on the experimental conditions. Figure B.7 shows the Heart Manikin scores across time and the conditions.
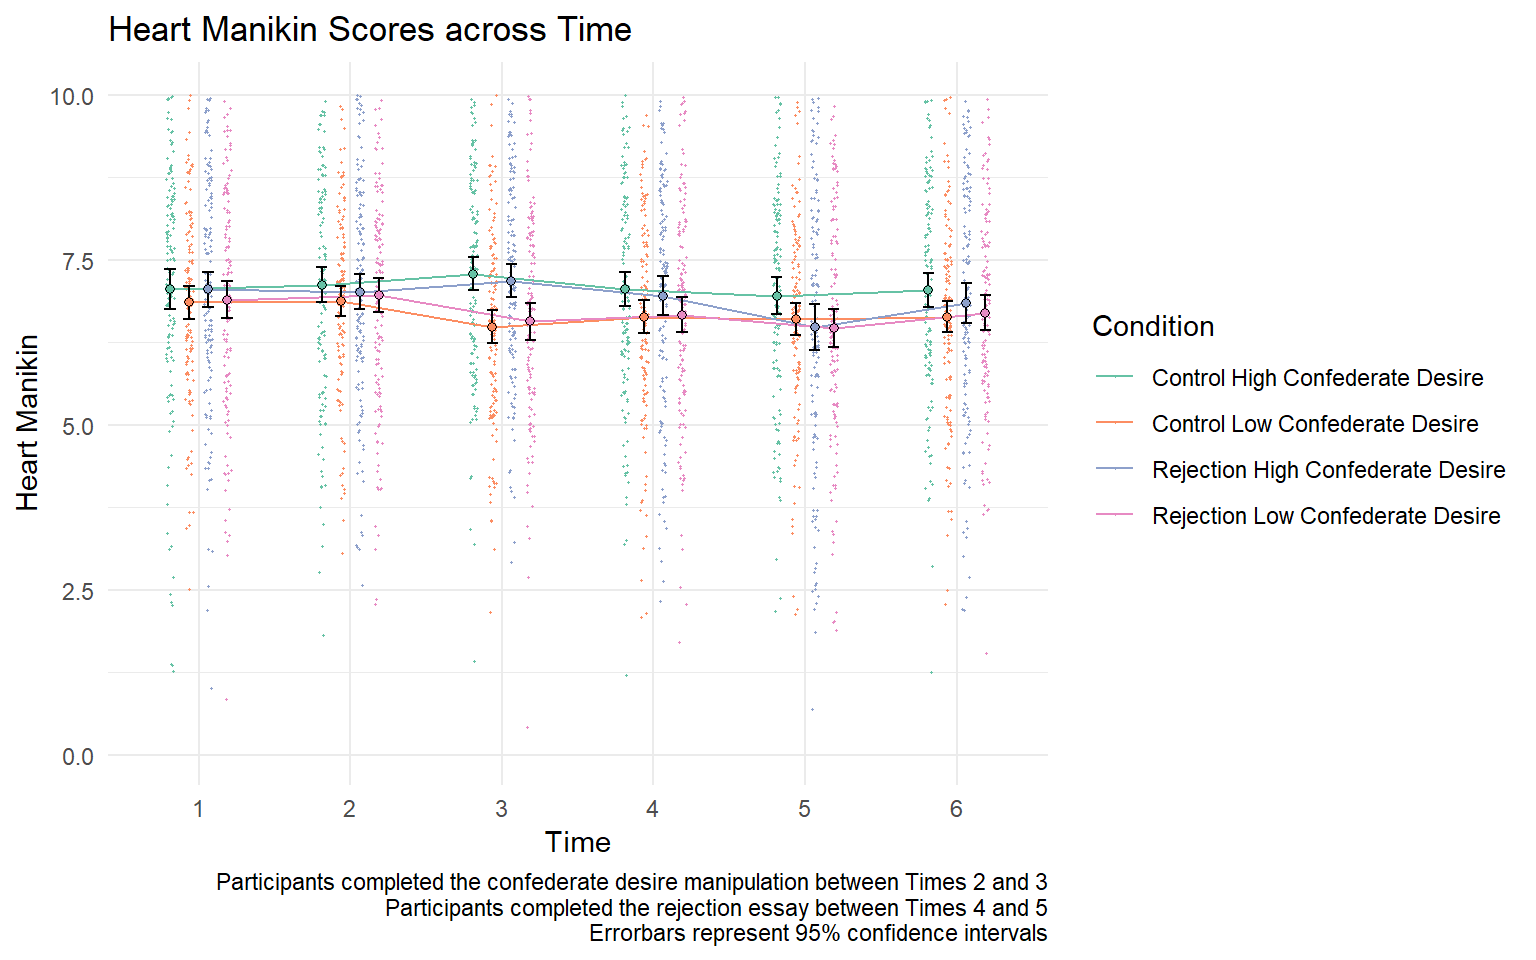
Figure B.7: Study 1e - Heart Manikin Scores
I also explored whether participants reported different levels of need-threat between Time 3 and Time 5. Results are plotted in Figure B.8
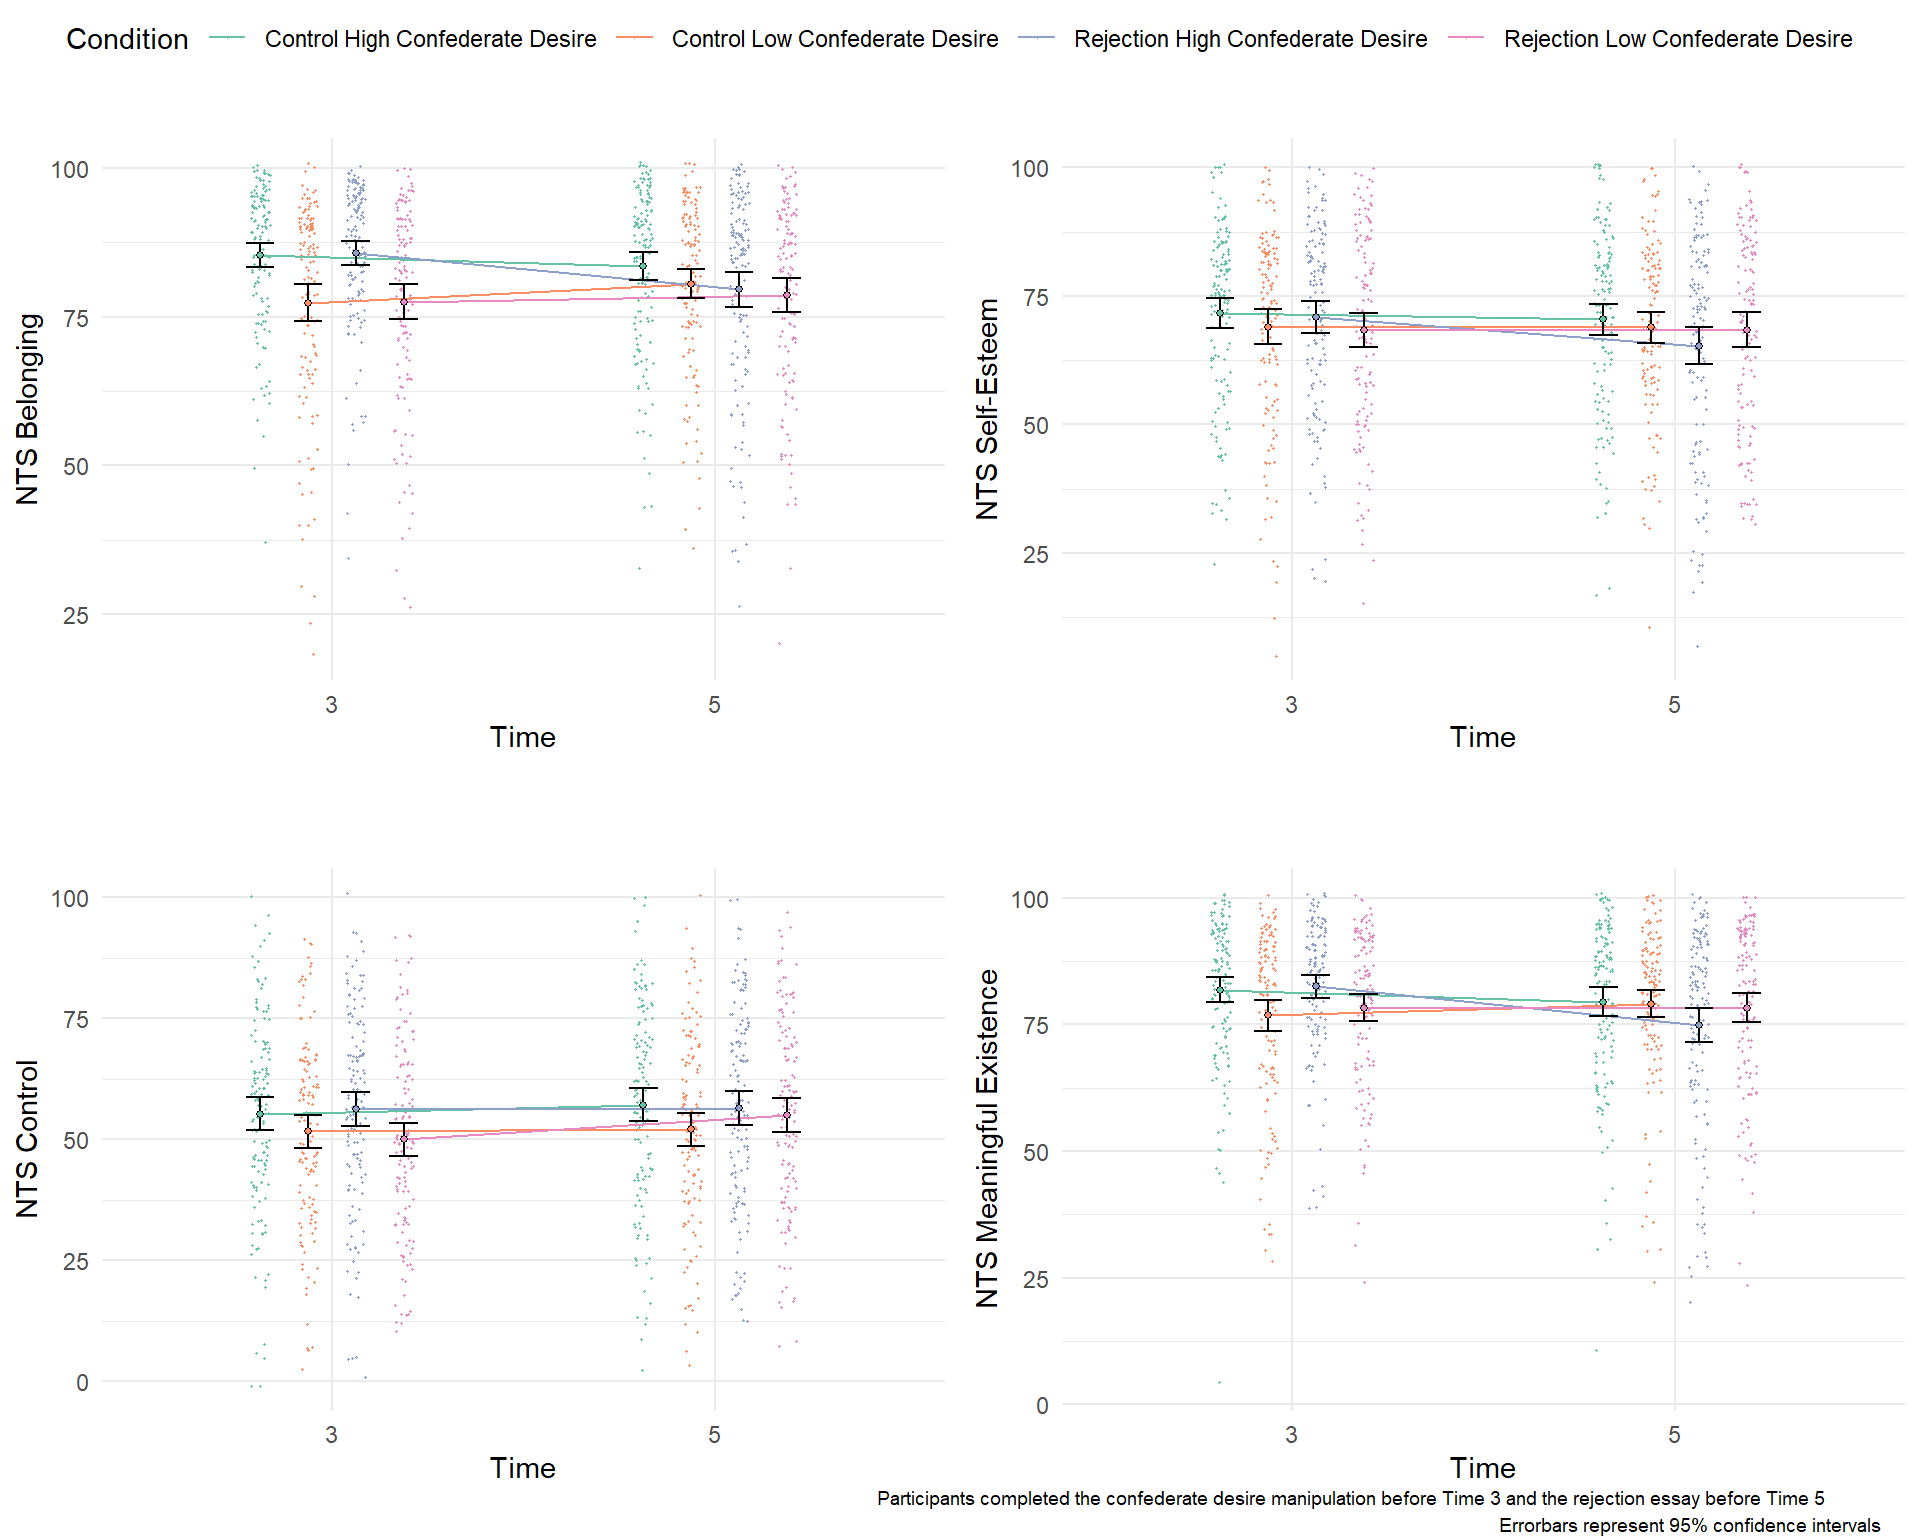
Figure B.8: Need-Threat Scores Across Time and Condition
I explored whether participants with higher (vs. lower) self-esteem reported different levels of need-threat at Time 5 (after rejection) in a regression model (predictors: the main effect of rejection, the main effect of self-esteem, and the interaction between rejection and self-esteem). Figure B.9 shows the results. I did not find evidence of moderation by self-esteem for the effect of social rejection.
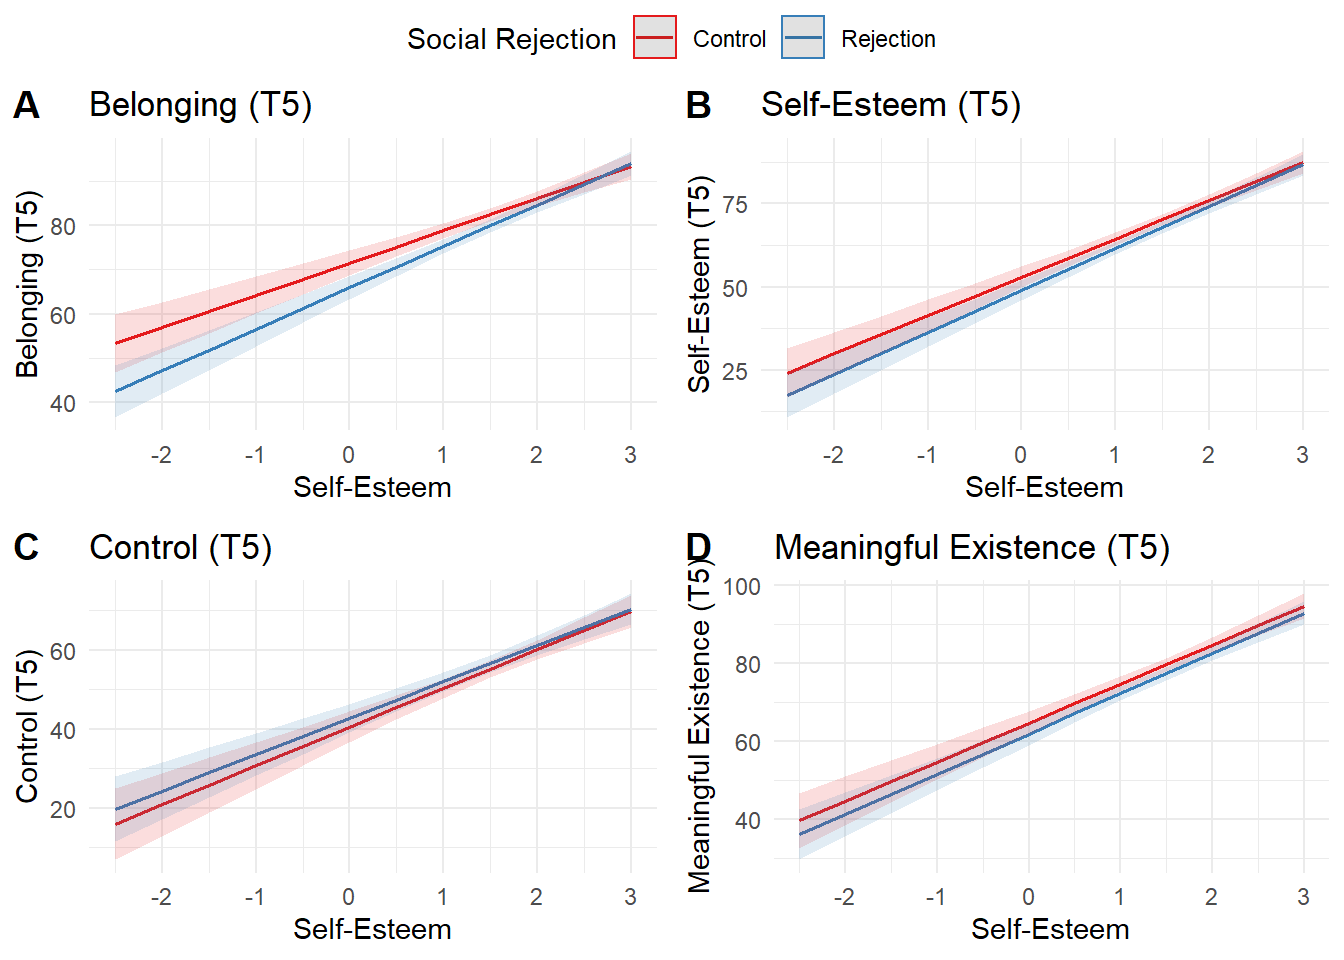
Figure B.9: Study 1e - Self-Esteem as a Possible Moderator for the Effect of Rejection on Need-Threat
B.2 Study 2
| Variable | \(n\) | \(M\) | \(SD\) | 1 | 2 | 3 | 4 | 5 | 6 | 7 | 8 | 9 | 10 | 11 | 12 | 13 |
|---|---|---|---|---|---|---|---|---|---|---|---|---|---|---|---|---|
|
359 | 6.21 | 1.98 | |||||||||||||
|
359 | 6.32 | 1.91 | .77* | ||||||||||||
|
359 | 5.93 | 1.89 | .72* | .62* | |||||||||||
|
359 | 6.25 | 1.76 | .57* | .74* | .71* | ||||||||||
|
359 | 4.22 | 1.69 | .06 | .06 | .16* | .09 | |||||||||
|
359 | 4.92 | 1.89 | .00 | .13* | .08 | .19* | .58* | ||||||||
|
359 | 5.83 | 1.65 | .30* | .31* | .31* | .30* | .14* | .19* | |||||||
|
359 | 6.10 | 1.63 | .27* | .38* | .27* | .39* | .08 | .25* | .85* | ||||||
|
211 | 3.07 | 1.76 | -.13 | -.04 | -.04 | .07 | -.03 | .13 | .13 | .12 | |||||
|
210 | 2.21 | 0.71 | -.11 | -.04 | -.03 | .12 | -.10 | .17* | -.01 | .01 | .60* | ||||
|
357 | 0.63 | 0.87 | .00 | -.01 | .06 | .08 | .04 | .13* | -.01 | .03 | .27* | .37* | |||
|
359 | 1.92 | 1.24 | .08 | .14* | .12* | .22* | -.05 | .10 | .08 | .14* | .24* | .29* | .40* | ||
|
358 | -0.12 | 1.82 | .02 | .05 | .05 | .15* | -.04 | .13* | -.02 | .04 | .48* | .57* | .41* | .28* | |
|
359 | 2.31 | 0.72 | .11* | .15* | .16* | .29* | -.02 | .06 | .13* | .15* | .21* | .27* | .37* | .41* | .31* |
| Note. The Ns for IOS and PSI are smaller since only people who indicated they interacted with a non-player character saw these questions. IOS = Inclusion of the Other in Self Scale. PSI = Parasocial Interactrion-Process Scale. Narrative Eng. = Narrative Engagement. |
B.2.1 Bivariate Scatter Plot Matrix
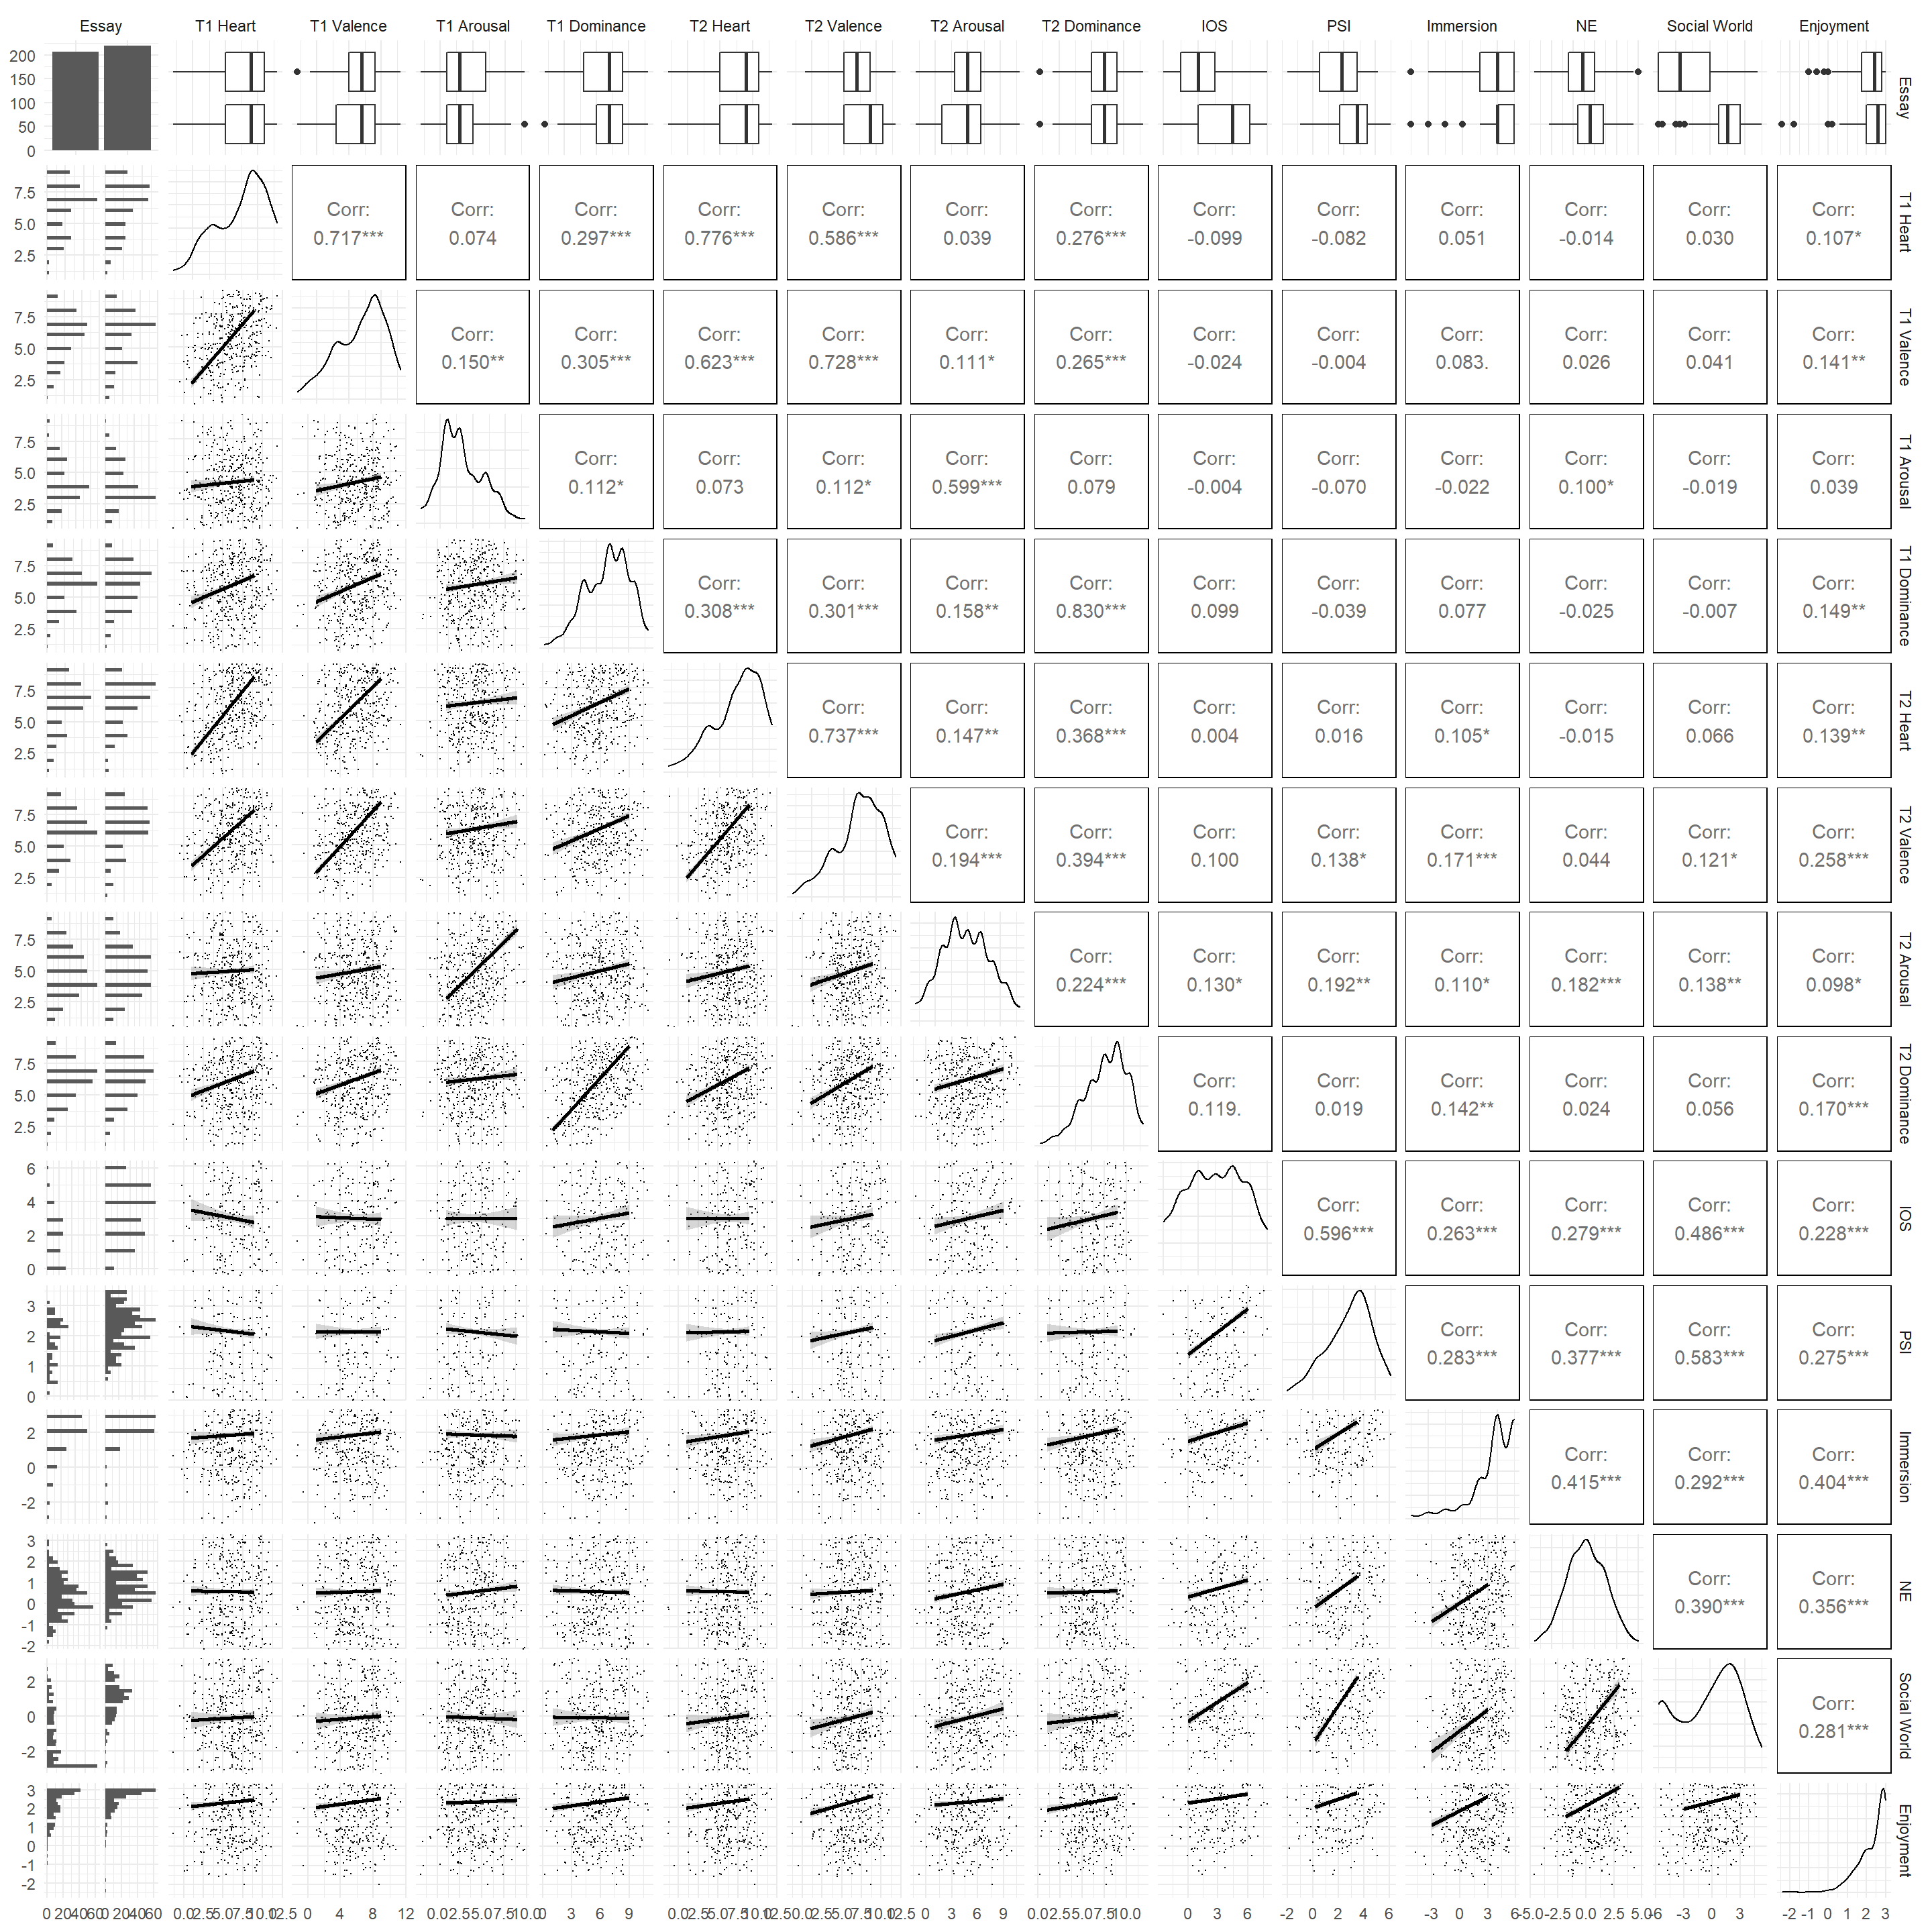
Figure B.10: Matrix Plot for Study 2 Variables
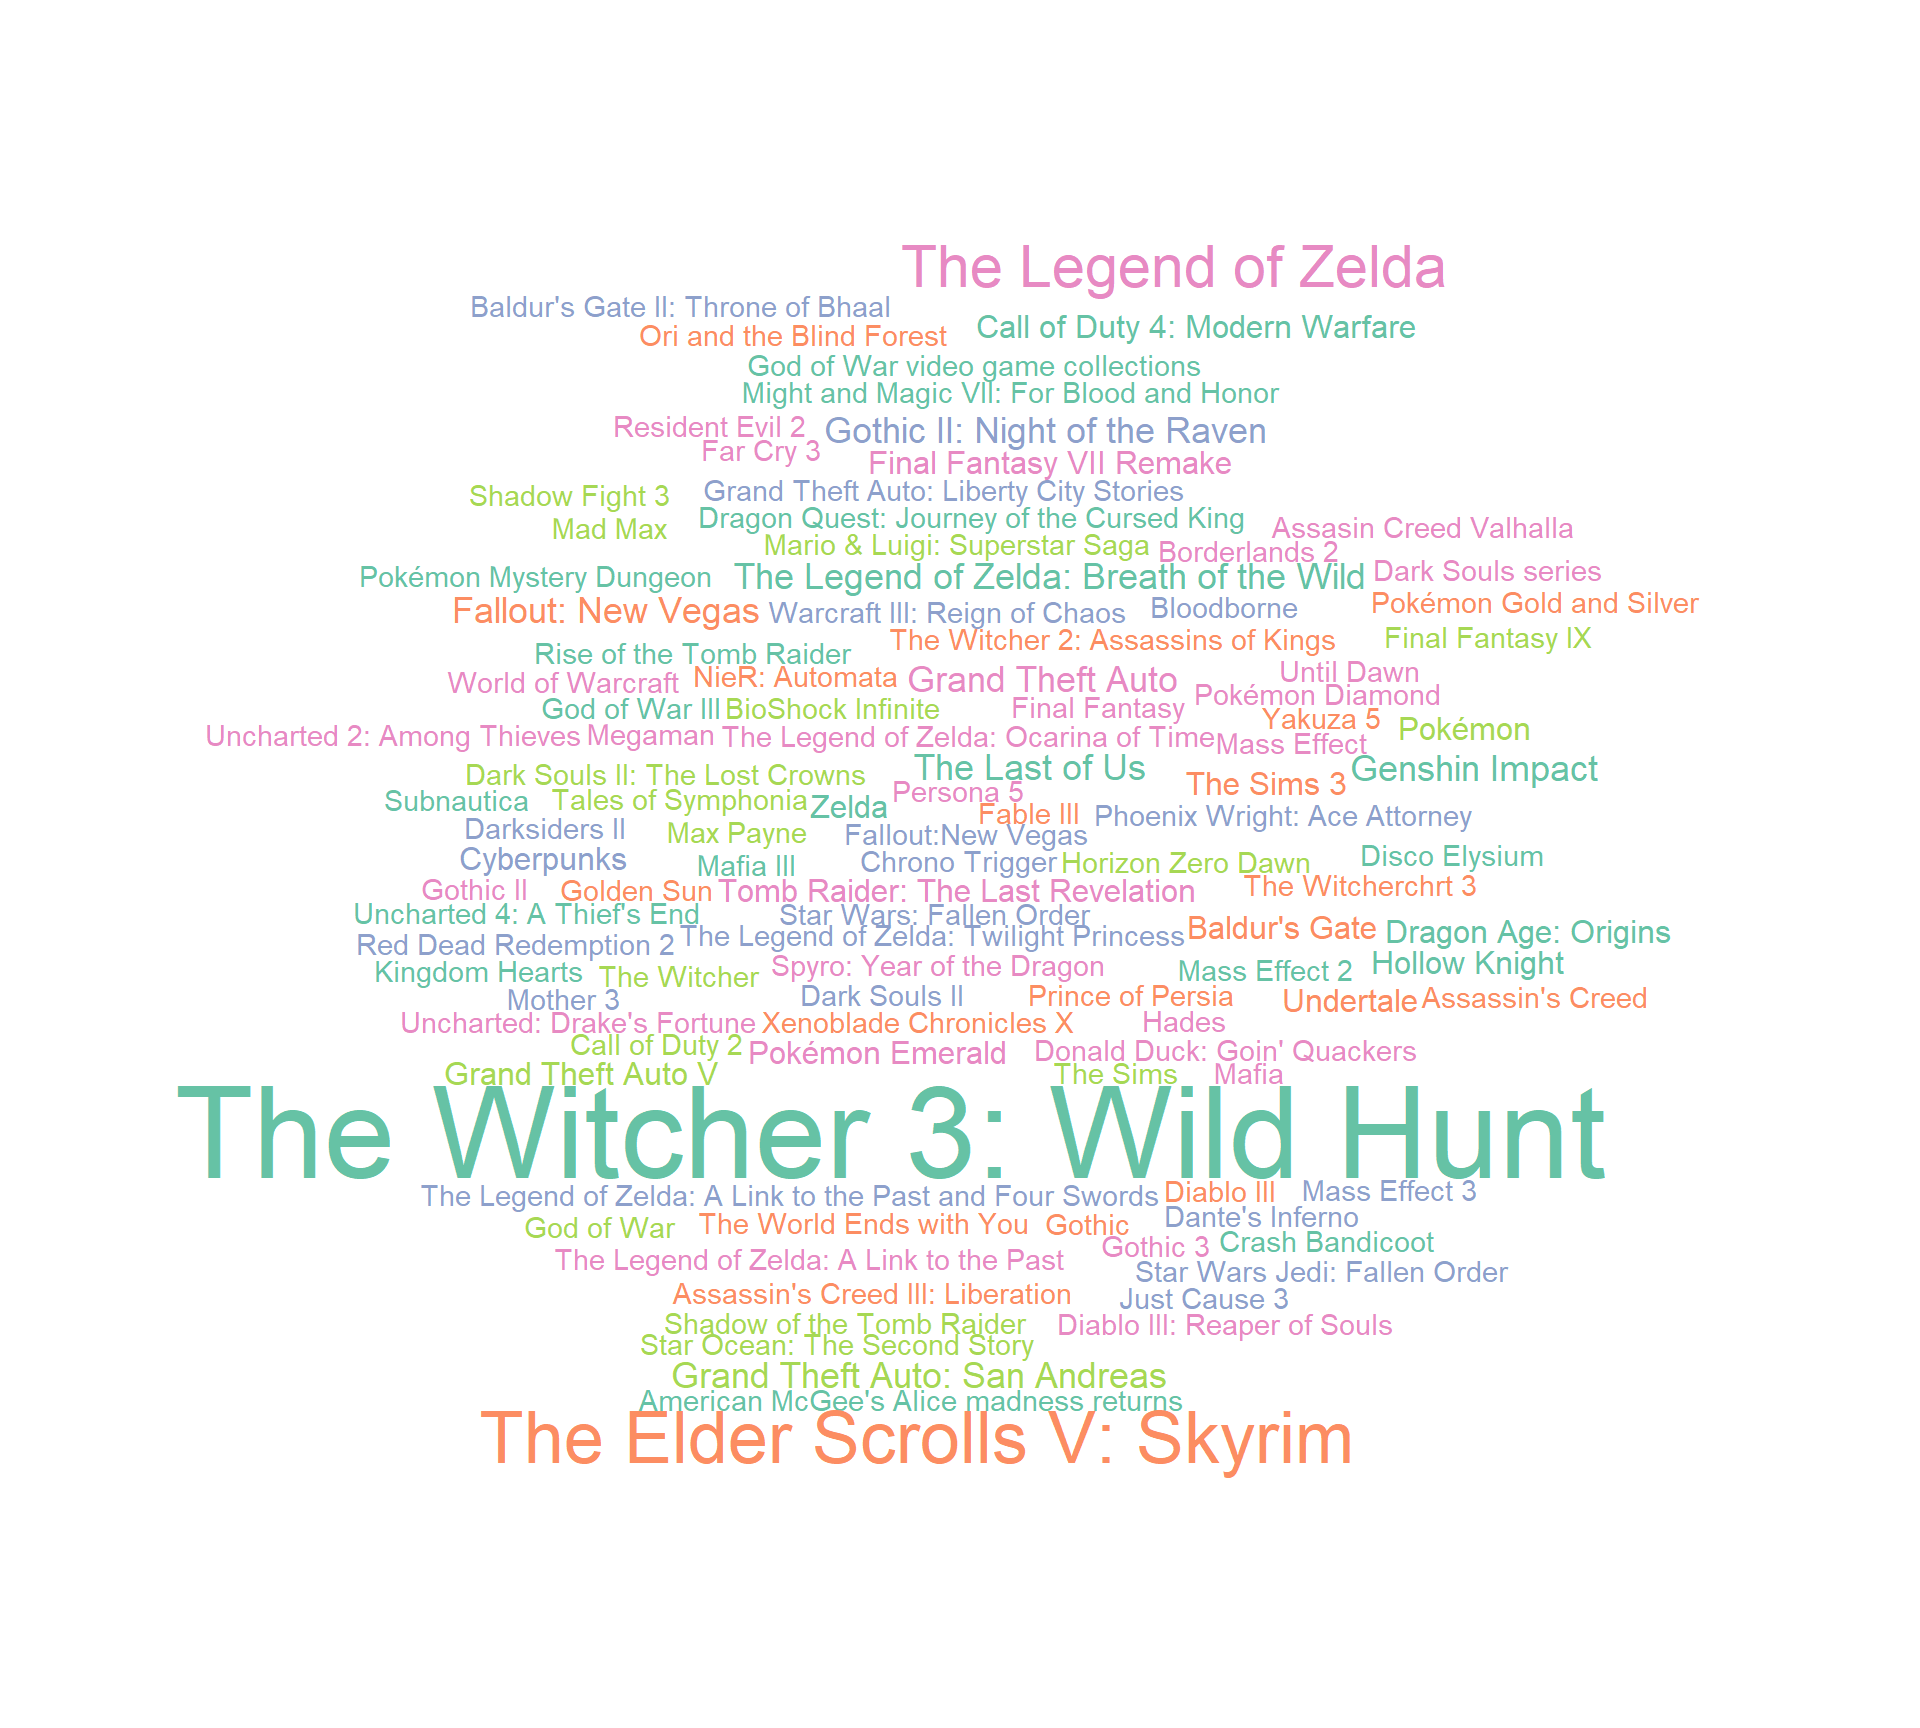
Figure B.11: Word Cloud for Game Titles for the Social Surrogate Condition
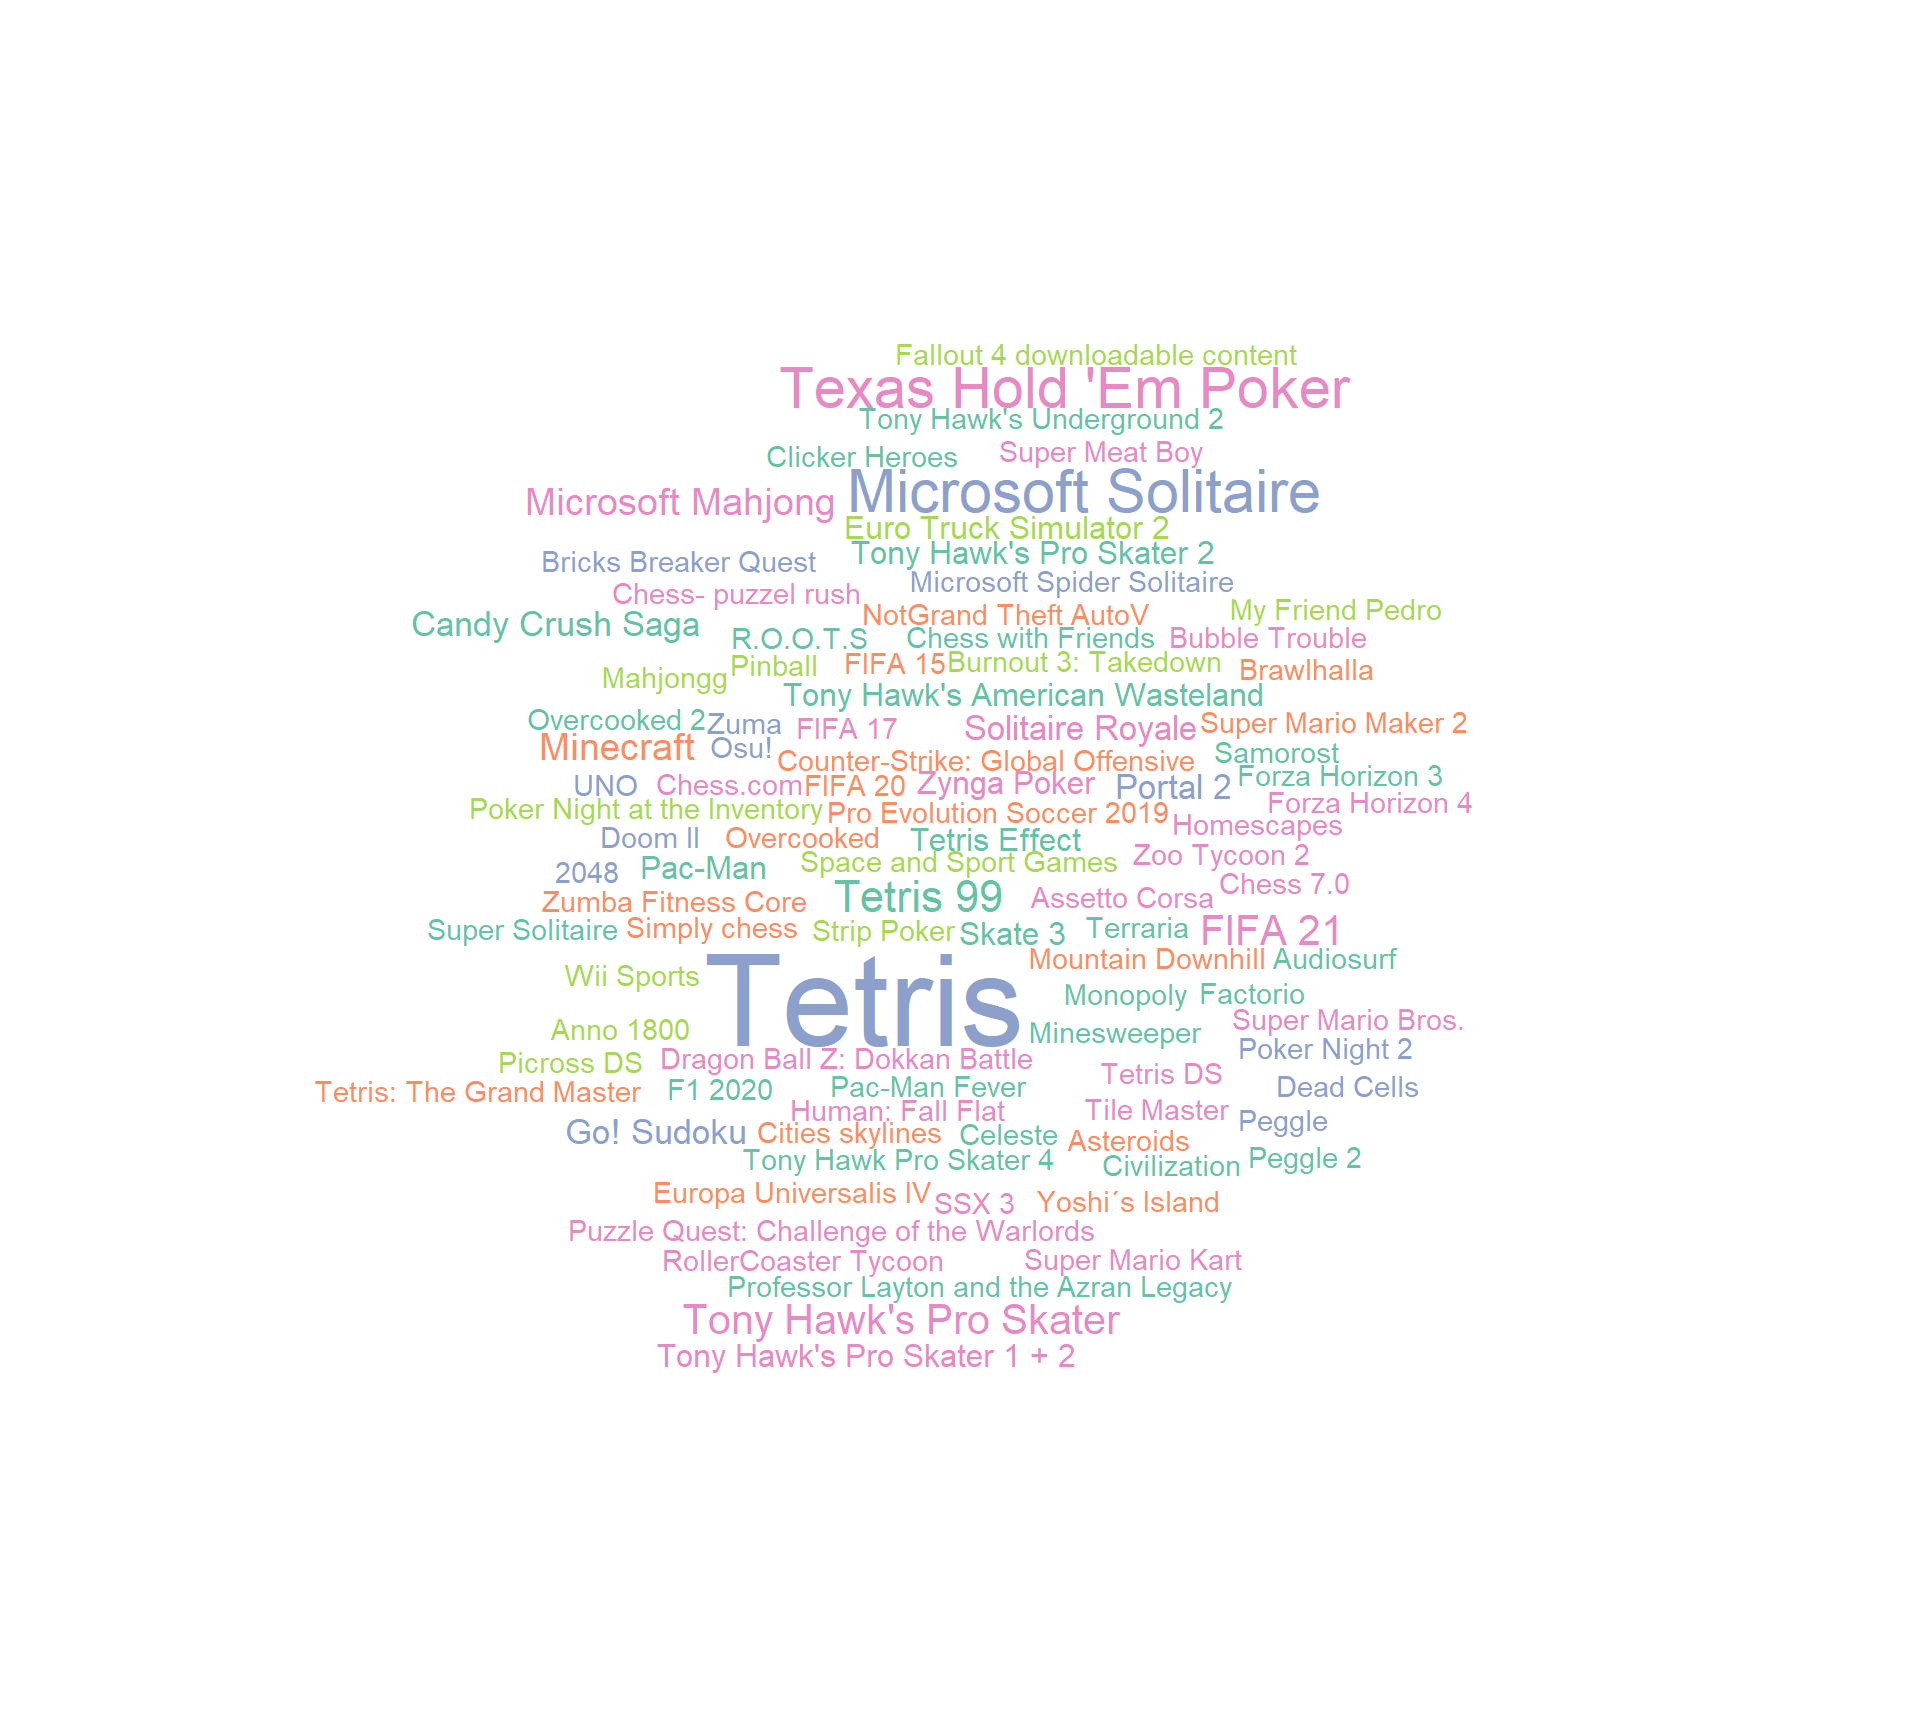
Figure B.12: Word Cloud for Game Titles for the Non-Social Surrogate Condition
B.2.2 Main Analysis with Excluded Participants
In the main analysis, I excluded participants based on the preregistered exclusion procedure. Here, I report results including all participants. I used the entire dataset including excluded participats to perform Welch’s t-test to compare the post-esaay Heart Manikin scores (Time 2) between the participants who wrote about the social surrogacy video game and those who wrote about the non-social surrogacy video game. Results were consistent with the analysis without the exculuded participants: participants who wrote about the social surrogacy game () reported similar levels of belonging compared with those who wrote about a non-surrogacy game (, t(417.2) = -0.35, p = .724).
B.2.3 Natural Language Processsing for Essays
I used natural language processing to explore words used in the video game essays. Figure B.13 shows the proportion of the words used within each essay conditions. Words such as “character” and “story” appeared more frequently in the social surrogate essays compared to non-social surrogate essays. On the other hand, words such as “cards,” “goal” appeared more frequently in the non-social surrogate essays than in social surrogate essays.
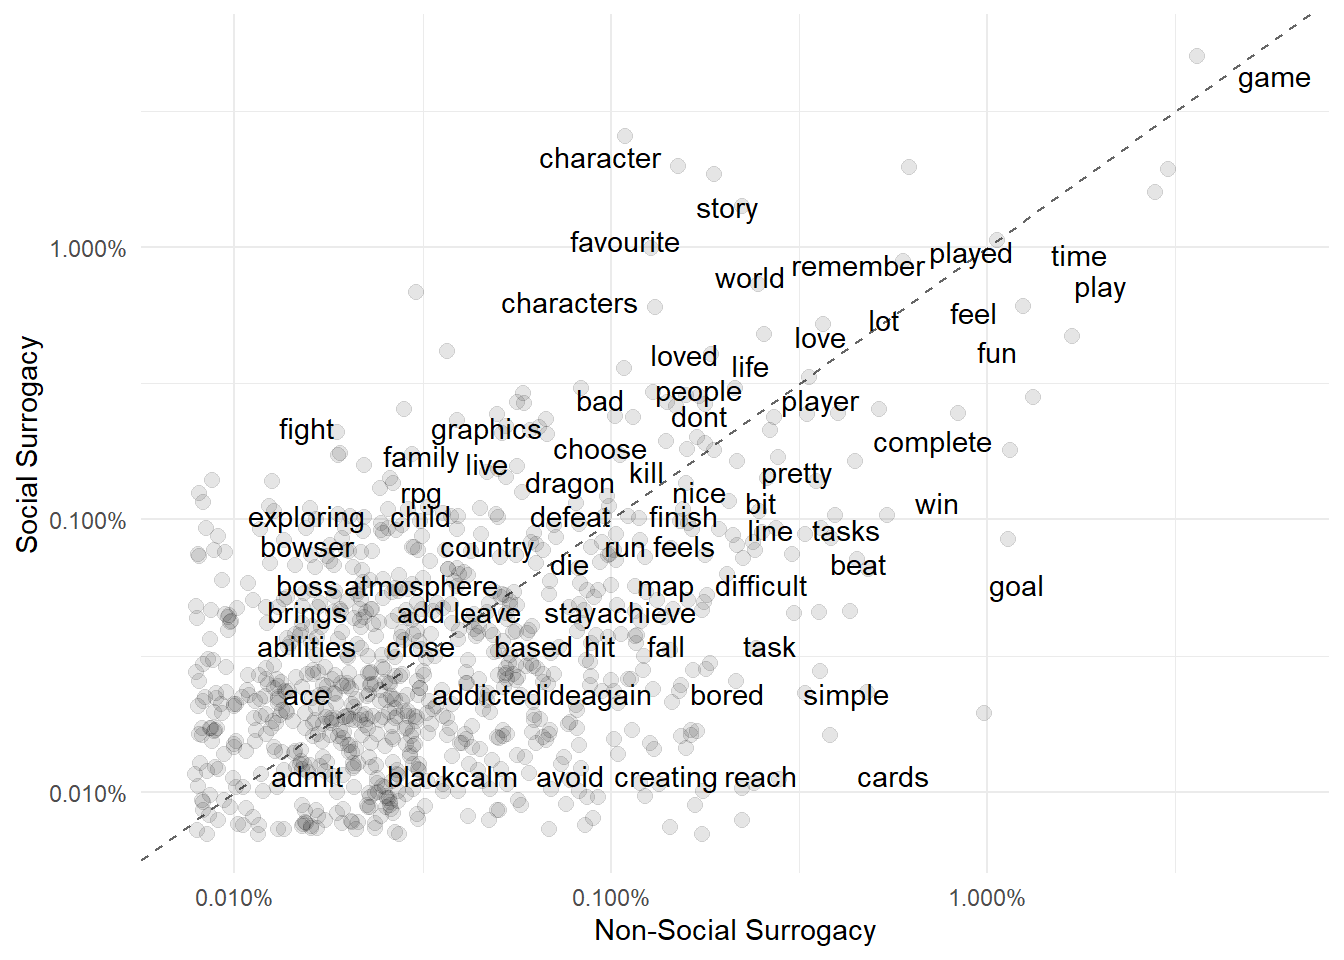
Figure B.13: Proportions of Words Used in Participants Essays Within Each Video Game Conditions. Words along the dashed line appeared equally in across social surrogacy and non-social surrogacy conditions. Words in the upper diagonal appeared more frequently in the social surrogacy condition than in the non-social surrogacy condition. Words in the lower diagnoal appeared more frequently in the non-social surrogacy condition.
B.2.4 Exit Questions
Participants saw two debrief questions, one referring to the purpose of the study, and another asking them to share anything about the study. I presented the debriefing questions in a randomized order to explore whether participants provided different amount of information if they were asked about the purpose of the study first, or they were asked to share anything. Results are presented in Figure B.14. In writing about the purpose of the study, participants who were asked about the purpose of the study first left a longer answer than those who were asked to share anything first.
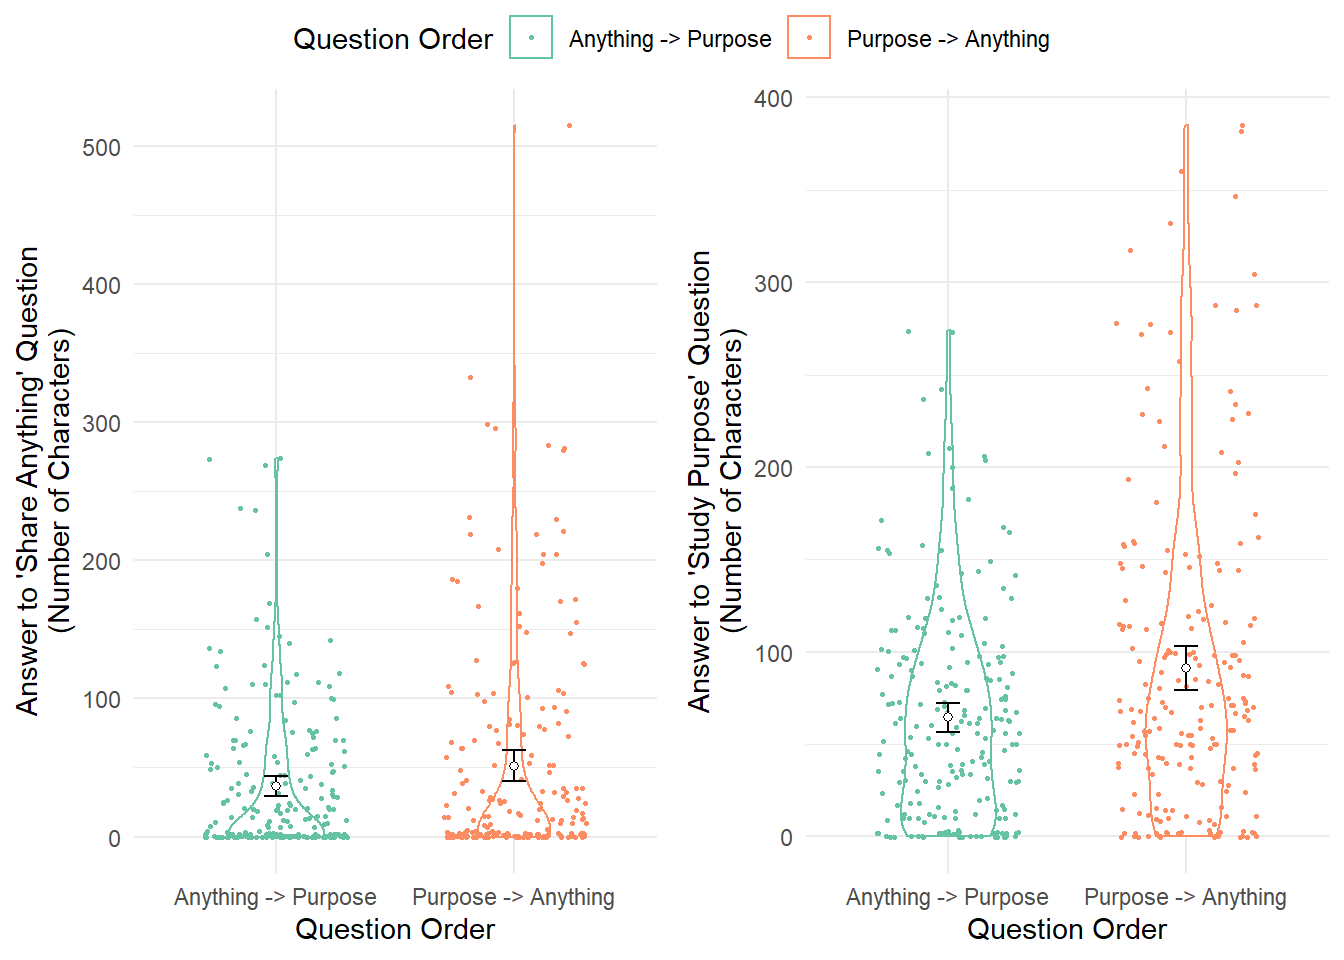
Figure B.14: Study 2 - Lengths of Participant Answers to Exit Questions Across Question Order
B.3 Study 3
| Variable | \(n\) | \(M\) | \(SD\) | 1 | 2 | 3 | 4 | 5 | 6 | 7 | 8 | 9 | 10 | 11 | 12 |
|---|---|---|---|---|---|---|---|---|---|---|---|---|---|---|---|
|
344 | 6.45 | 1.90 | ||||||||||||
|
344 | 6.24 | 1.87 | .66* | |||||||||||
|
344 | 6.00 | 1.91 | .65* | .46* | ||||||||||
|
344 | 5.64 | 2.30 | .28* | .57* | .33* | |||||||||
|
344 | 4.24 | 1.76 | .28* | .21* | .32* | .22* | ||||||||
|
344 | 5.01 | 1.97 | .17* | .33* | .17* | .52* | .43* | |||||||
|
343 | 6.04 | 1.63 | .33* | .28* | .33* | .16* | .15* | .07 | ||||||
|
343 | 6.25 | 1.72 | .19* | .51* | .18* | .49* | .11* | .29* | .51* | |||||
|
272 | 2.81 | 1.72 | .08 | .15* | .06 | .27* | .14* | .26* | .08 | .29* | ||||
|
344 | 0.21 | 1.81 | .10 | .33* | .11* | .53* | .10 | .33* | -.04 | .27* | .32* | |||
|
337 | -0.23 | 1.52 | .13* | .33* | .10 | .53* | .11* | .35* | -.02 | .31* | .32* | .77* | ||
|
315 | -0.90 | 0.96 | .07 | .24* | .07 | .39* | .18* | .30* | .05 | .27* | .34* | .50* | .60* | |
|
342 | -0.43 | 1.62 | .03 | .28* | .04 | .55* | -.01 | .31* | -.08 | .29* | .25* | .71* | .79* | .63* |
| Note. *p .05. IOS = Inclusion of the Other in Self Scale. The N of IOS is smaller since only those interacted with an NPC answered this question. The Ns for dominance, social world, identification, and enjoyment are smaller due to programming errors and participants skipping questions. |
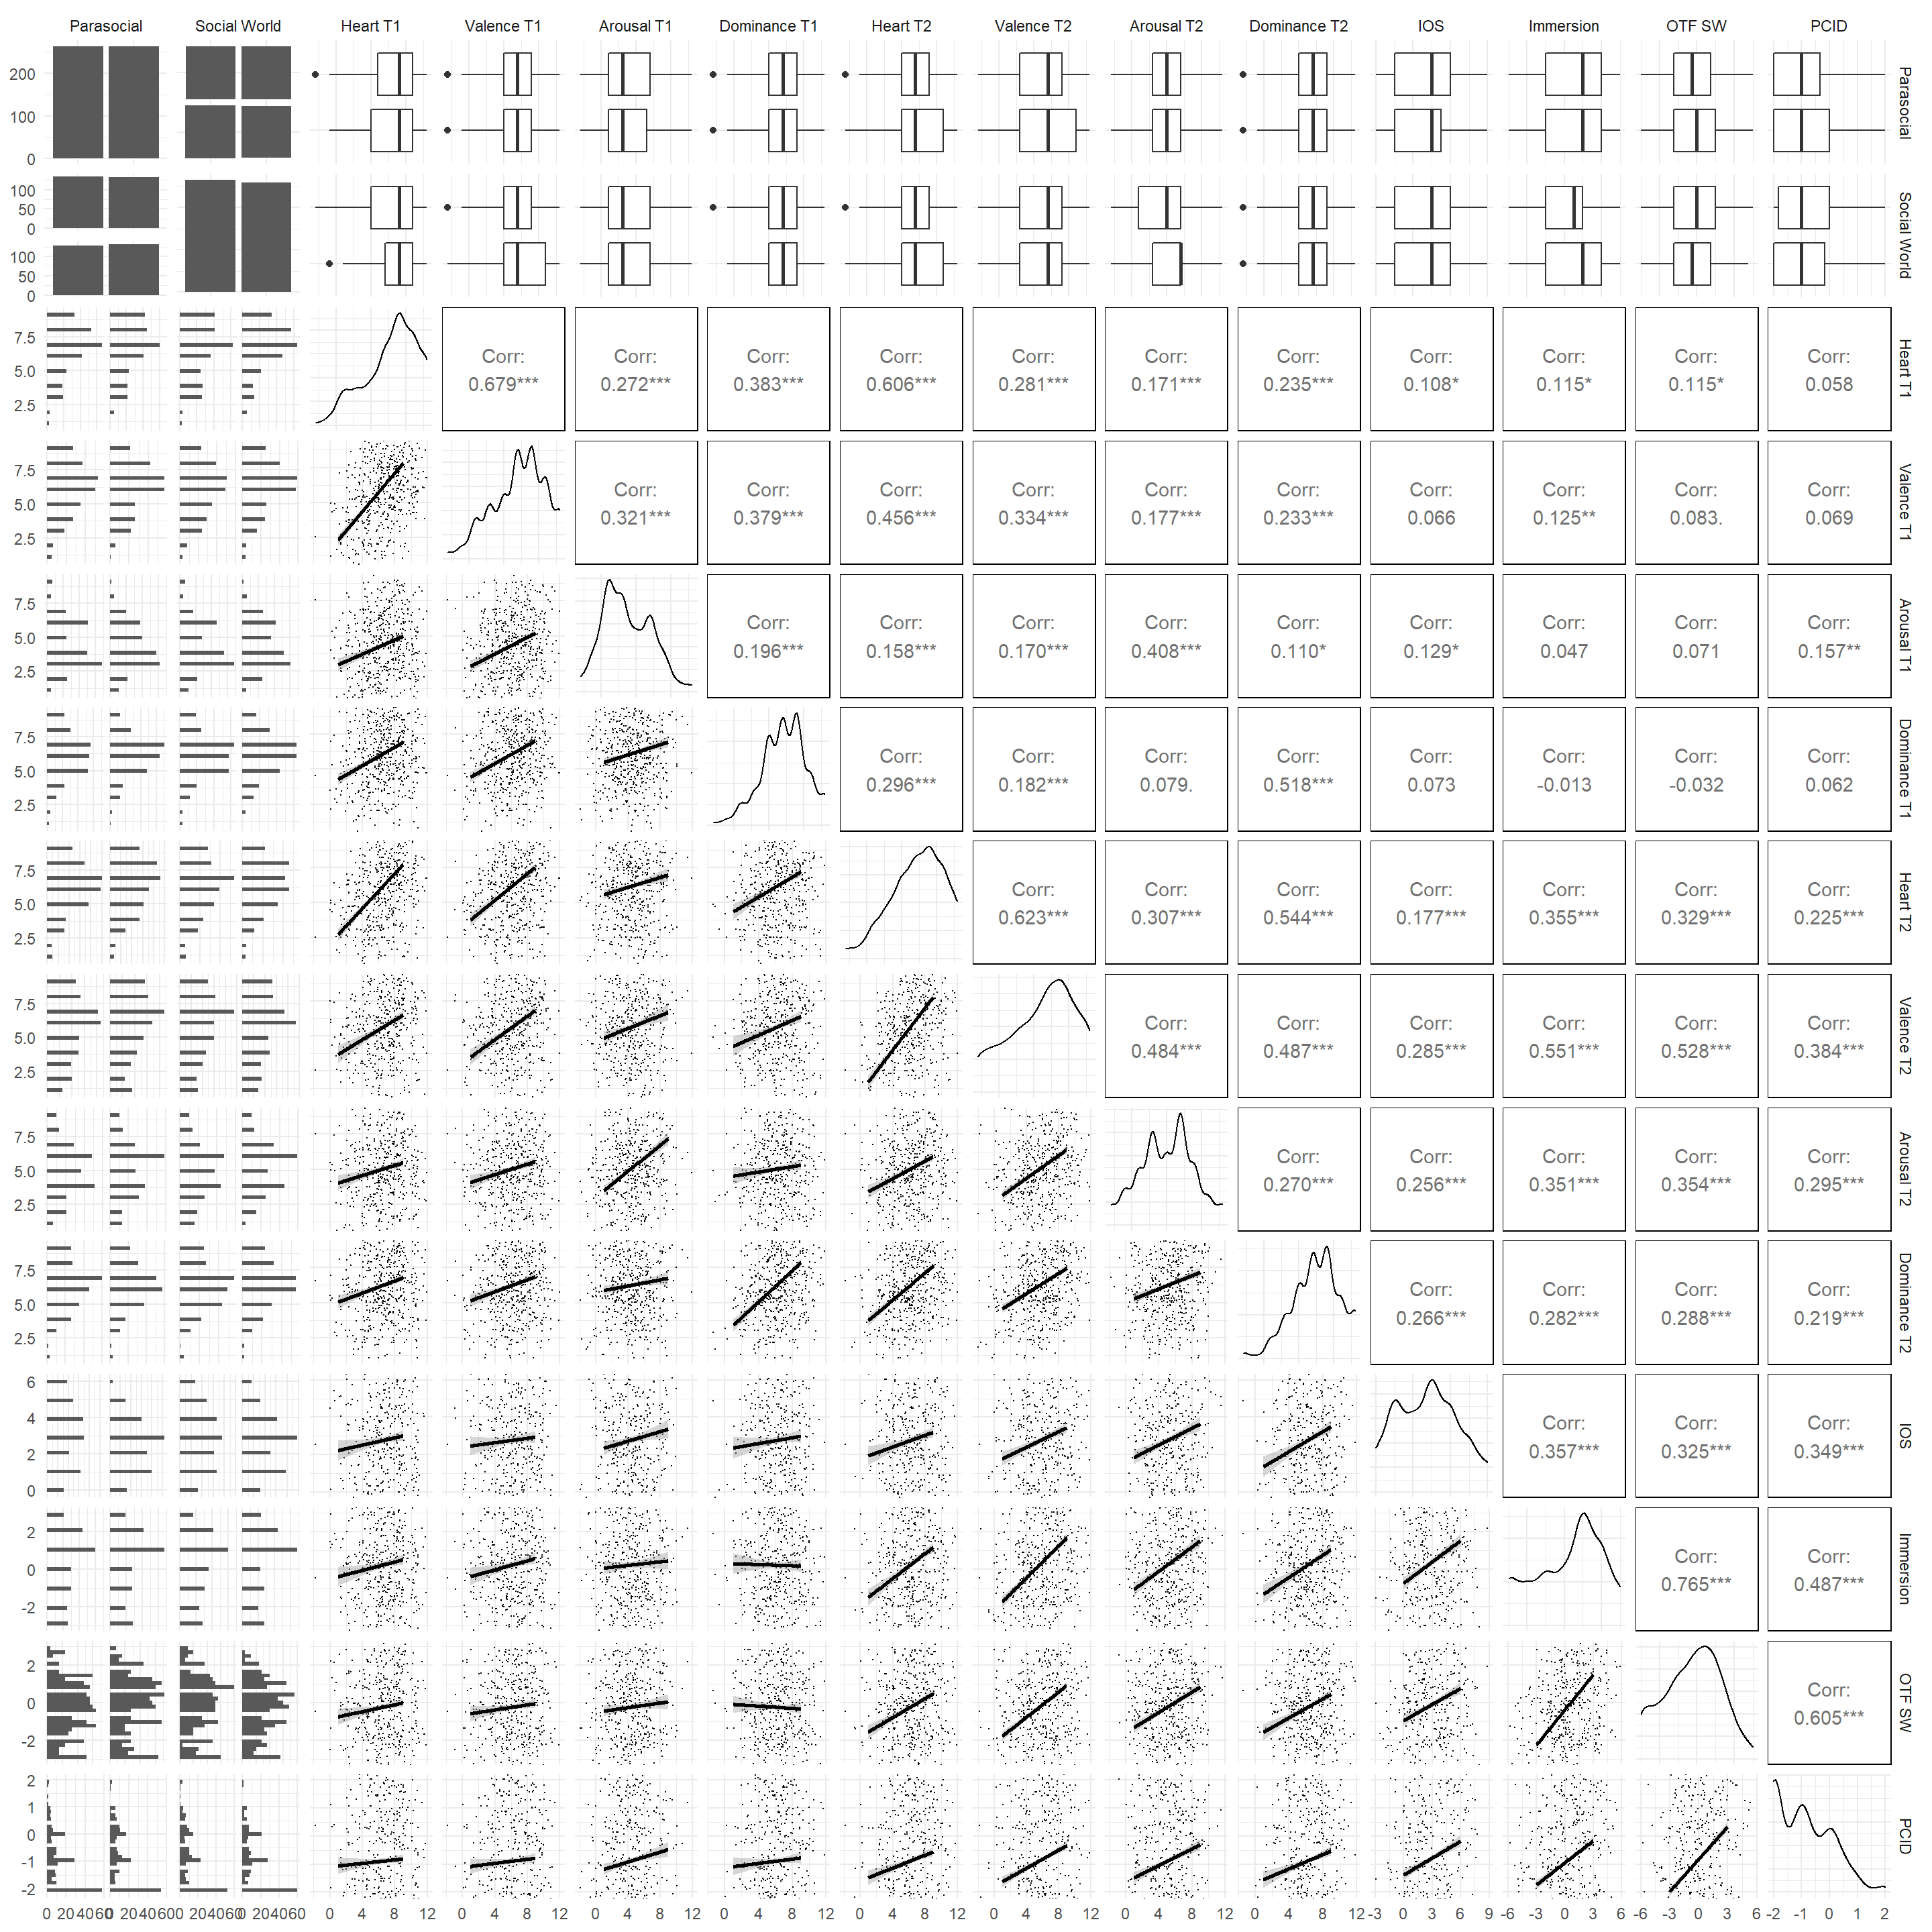
Figure B.15: Study 3 - Bivariate Scatter Plot Matrix